Alsatian vs Immigrants from Norway Householder Income Ages 45 - 64 years
COMPARE
Alsatian
Immigrants from Norway
Householder Income Ages 45 - 64 years
Householder Income Ages 45 - 64 years Comparison
Alsatians
Immigrants from Norway
$100,435
HOUSEHOLDER INCOME AGES 45 - 64 YEARS
51.4/ 100
METRIC RATING
173rd/ 347
METRIC RANK
$111,669
HOUSEHOLDER INCOME AGES 45 - 64 YEARS
99.7/ 100
METRIC RATING
62nd/ 347
METRIC RANK
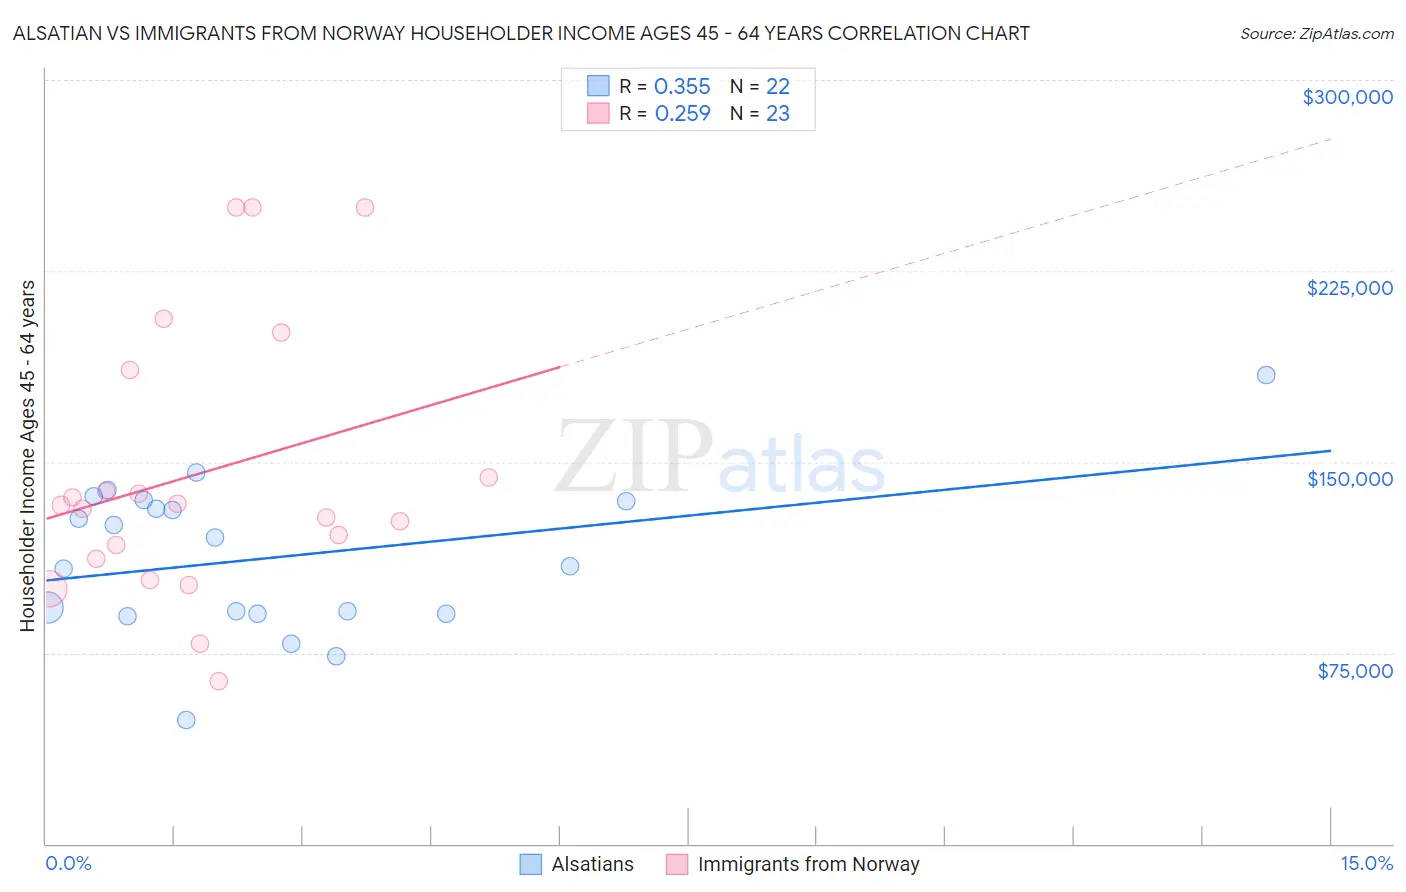
Alsatian vs Immigrants from Norway Householder Income Ages 45 - 64 years Correlation Chart
The statistical analysis conducted on geographies consisting of 82,661,679 people shows a mild positive correlation between the proportion of Alsatians and household income with householder between the ages 45 and 64 in the United States with a correlation coefficient (R) of 0.355 and weighted average of $100,435. Similarly, the statistical analysis conducted on geographies consisting of 116,657,782 people shows a weak positive correlation between the proportion of Immigrants from Norway and household income with householder between the ages 45 and 64 in the United States with a correlation coefficient (R) of 0.259 and weighted average of $111,669, a difference of 11.2%.
Householder Income Ages 45 - 64 years Correlation Summary
| Measurement | Alsatian | Immigrants from Norway |
| Minimum | $48,731 | $63,891 |
| Maximum | $184,018 | $250,001 |
| Range | $135,287 | $186,110 |
| Mean | $112,529 | $145,670 |
| Median | $114,674 | $132,825 |
| Interquartile 25% (IQ1) | $90,588 | $111,854 |
| Interquartile 75% (IQ3) | $134,688 | $186,082 |
| Interquartile Range (IQR) | $44,100 | $74,228 |
| Standard Deviation (Sample) | $30,232 | $53,028 |
| Standard Deviation (Population) | $29,537 | $51,863 |
Similar Demographics by Householder Income Ages 45 - 64 years
Demographics Similar to Alsatians by Householder Income Ages 45 - 64 years
In terms of householder income ages 45 - 64 years, the demographic groups most similar to Alsatians are Immigrants from Uzbekistan ($100,523, a difference of 0.090%), Welsh ($100,322, a difference of 0.11%), German ($100,224, a difference of 0.21%), Immigrants from Costa Rica ($100,141, a difference of 0.29%), and Moroccan ($100,138, a difference of 0.30%).
| Demographics | Rating | Rank | Householder Income Ages 45 - 64 years |
| Samoans | 65.3 /100 | #166 | Good $101,580 |
| Czechoslovakians | 63.0 /100 | #167 | Good $101,387 |
| South American Indians | 60.5 /100 | #168 | Good $101,171 |
| Guamanians/Chamorros | 60.5 /100 | #169 | Good $101,170 |
| Slovaks | 58.8 /100 | #170 | Average $101,029 |
| South Americans | 56.4 /100 | #171 | Average $100,837 |
| Immigrants | Uzbekistan | 52.5 /100 | #172 | Average $100,523 |
| Alsatians | 51.4 /100 | #173 | Average $100,435 |
| Welsh | 50.0 /100 | #174 | Average $100,322 |
| Germans | 48.8 /100 | #175 | Average $100,224 |
| Immigrants | Costa Rica | 47.7 /100 | #176 | Average $100,141 |
| Moroccans | 47.7 /100 | #177 | Average $100,138 |
| Immigrants | Cameroon | 47.0 /100 | #178 | Average $100,084 |
| Belgians | 46.7 /100 | #179 | Average $100,060 |
| Aleuts | 46.6 /100 | #180 | Average $100,052 |
Demographics Similar to Immigrants from Norway by Householder Income Ages 45 - 64 years
In terms of householder income ages 45 - 64 years, the demographic groups most similar to Immigrants from Norway are Mongolian ($111,602, a difference of 0.060%), Immigrants from Latvia ($111,454, a difference of 0.19%), Immigrants from Belarus ($111,430, a difference of 0.21%), Immigrants from Czechoslovakia ($111,914, a difference of 0.22%), and Immigrants from Europe ($111,984, a difference of 0.28%).
| Demographics | Rating | Rank | Householder Income Ages 45 - 64 years |
| Lithuanians | 99.8 /100 | #55 | Exceptional $112,484 |
| Egyptians | 99.7 /100 | #56 | Exceptional $112,256 |
| Immigrants | Scotland | 99.7 /100 | #57 | Exceptional $112,175 |
| Soviet Union | 99.7 /100 | #58 | Exceptional $112,008 |
| Immigrants | Europe | 99.7 /100 | #59 | Exceptional $111,984 |
| Immigrants | Netherlands | 99.7 /100 | #60 | Exceptional $111,982 |
| Immigrants | Czechoslovakia | 99.7 /100 | #61 | Exceptional $111,914 |
| Immigrants | Norway | 99.7 /100 | #62 | Exceptional $111,669 |
| Mongolians | 99.6 /100 | #63 | Exceptional $111,602 |
| Immigrants | Latvia | 99.6 /100 | #64 | Exceptional $111,454 |
| Immigrants | Belarus | 99.6 /100 | #65 | Exceptional $111,430 |
| New Zealanders | 99.6 /100 | #66 | Exceptional $111,286 |
| Laotians | 99.5 /100 | #67 | Exceptional $111,051 |
| Immigrants | Romania | 99.4 /100 | #68 | Exceptional $110,633 |
| Immigrants | Italy | 99.4 /100 | #69 | Exceptional $110,434 |