Aleut vs Immigrants from Nicaragua Male Poverty
COMPARE
Aleut
Immigrants from Nicaragua
Male Poverty
Male Poverty Comparison
Aleuts
Immigrants from Nicaragua
11.8%
MALE POVERTY
10.4/ 100
METRIC RATING
202nd/ 347
METRIC RANK
12.9%
MALE POVERTY
0.2/ 100
METRIC RATING
250th/ 347
METRIC RANK
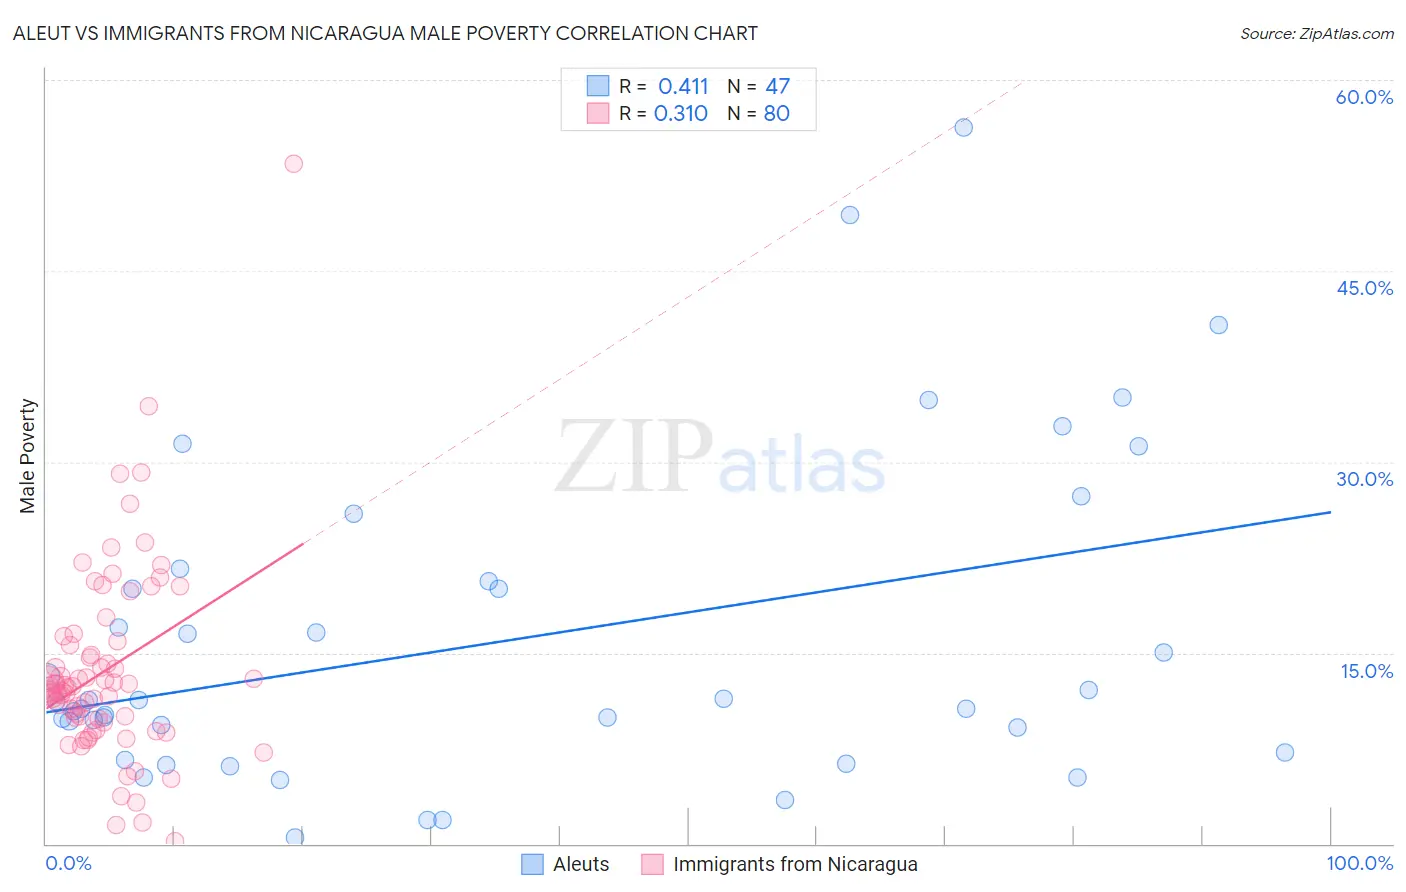
Aleut vs Immigrants from Nicaragua Male Poverty Correlation Chart
The statistical analysis conducted on geographies consisting of 61,774,316 people shows a moderate positive correlation between the proportion of Aleuts and poverty level among males in the United States with a correlation coefficient (R) of 0.411 and weighted average of 11.8%. Similarly, the statistical analysis conducted on geographies consisting of 236,310,825 people shows a mild positive correlation between the proportion of Immigrants from Nicaragua and poverty level among males in the United States with a correlation coefficient (R) of 0.310 and weighted average of 12.9%, a difference of 9.6%.
Male Poverty Correlation Summary
| Measurement | Aleut | Immigrants from Nicaragua |
| Minimum | 0.53% | 0.19% |
| Maximum | 56.2% | 53.4% |
| Range | 55.7% | 53.2% |
| Mean | 15.9% | 13.6% |
| Median | 11.2% | 12.3% |
| Interquartile 25% (IQ1) | 7.1% | 9.7% |
| Interquartile 75% (IQ3) | 20.6% | 15.8% |
| Interquartile Range (IQR) | 13.5% | 6.1% |
| Standard Deviation (Sample) | 12.6% | 7.7% |
| Standard Deviation (Population) | 12.4% | 7.7% |
Similar Demographics by Male Poverty
Demographics Similar to Aleuts by Male Poverty
In terms of male poverty, the demographic groups most similar to Aleuts are Immigrants from Western Asia (11.8%, a difference of 0.14%), Immigrants from Uganda (11.8%, a difference of 0.50%), Spaniard (11.7%, a difference of 0.71%), Immigrants from Lebanon (11.7%, a difference of 0.72%), and Spanish (11.7%, a difference of 0.82%).
| Demographics | Rating | Rank | Male Poverty |
| Arabs | 15.8 /100 | #195 | Poor 11.6% |
| Hmong | 15.8 /100 | #196 | Poor 11.6% |
| Delaware | 15.4 /100 | #197 | Poor 11.7% |
| Iraqis | 14.7 /100 | #198 | Poor 11.7% |
| Spanish | 14.1 /100 | #199 | Poor 11.7% |
| Immigrants | Lebanon | 13.6 /100 | #200 | Poor 11.7% |
| Spaniards | 13.5 /100 | #201 | Poor 11.7% |
| Aleuts | 10.4 /100 | #202 | Poor 11.8% |
| Immigrants | Western Asia | 9.8 /100 | #203 | Tragic 11.8% |
| Immigrants | Uganda | 8.5 /100 | #204 | Tragic 11.8% |
| Panamanians | 6.2 /100 | #205 | Tragic 11.9% |
| Immigrants | Eastern Africa | 5.4 /100 | #206 | Tragic 12.0% |
| Malaysians | 5.2 /100 | #207 | Tragic 12.0% |
| Immigrants | Immigrants | 4.5 /100 | #208 | Tragic 12.0% |
| Immigrants | Azores | 4.3 /100 | #209 | Tragic 12.0% |
Demographics Similar to Immigrants from Nicaragua by Male Poverty
In terms of male poverty, the demographic groups most similar to Immigrants from Nicaragua are Potawatomi (12.9%, a difference of 0.010%), Immigrants from Sudan (12.9%, a difference of 0.080%), Immigrants from Cuba (12.9%, a difference of 0.10%), Immigrants from Ecuador (12.9%, a difference of 0.13%), and Immigrants from Western Africa (12.9%, a difference of 0.14%).
| Demographics | Rating | Rank | Male Poverty |
| Alaskan Athabascans | 0.3 /100 | #243 | Tragic 12.8% |
| Tsimshian | 0.3 /100 | #244 | Tragic 12.8% |
| Liberians | 0.3 /100 | #245 | Tragic 12.8% |
| Immigrants | El Salvador | 0.2 /100 | #246 | Tragic 12.8% |
| Immigrants | Western Africa | 0.2 /100 | #247 | Tragic 12.9% |
| Immigrants | Sudan | 0.2 /100 | #248 | Tragic 12.9% |
| Potawatomi | 0.2 /100 | #249 | Tragic 12.9% |
| Immigrants | Nicaragua | 0.2 /100 | #250 | Tragic 12.9% |
| Immigrants | Cuba | 0.2 /100 | #251 | Tragic 12.9% |
| Immigrants | Ecuador | 0.2 /100 | #252 | Tragic 12.9% |
| Immigrants | Ghana | 0.2 /100 | #253 | Tragic 12.9% |
| Mexican American Indians | 0.1 /100 | #254 | Tragic 13.0% |
| Immigrants | Liberia | 0.1 /100 | #255 | Tragic 13.0% |
| Immigrants | Burma/Myanmar | 0.1 /100 | #256 | Tragic 13.0% |
| Immigrants | Trinidad and Tobago | 0.1 /100 | #257 | Tragic 13.1% |