Aleut vs Immigrants from Trinidad and Tobago Male Poverty
COMPARE
Aleut
Immigrants from Trinidad and Tobago
Male Poverty
Male Poverty Comparison
Aleuts
Immigrants from Trinidad and Tobago
11.8%
MALE POVERTY
10.4/ 100
METRIC RATING
202nd/ 347
METRIC RANK
13.1%
MALE POVERTY
0.1/ 100
METRIC RATING
257th/ 347
METRIC RANK
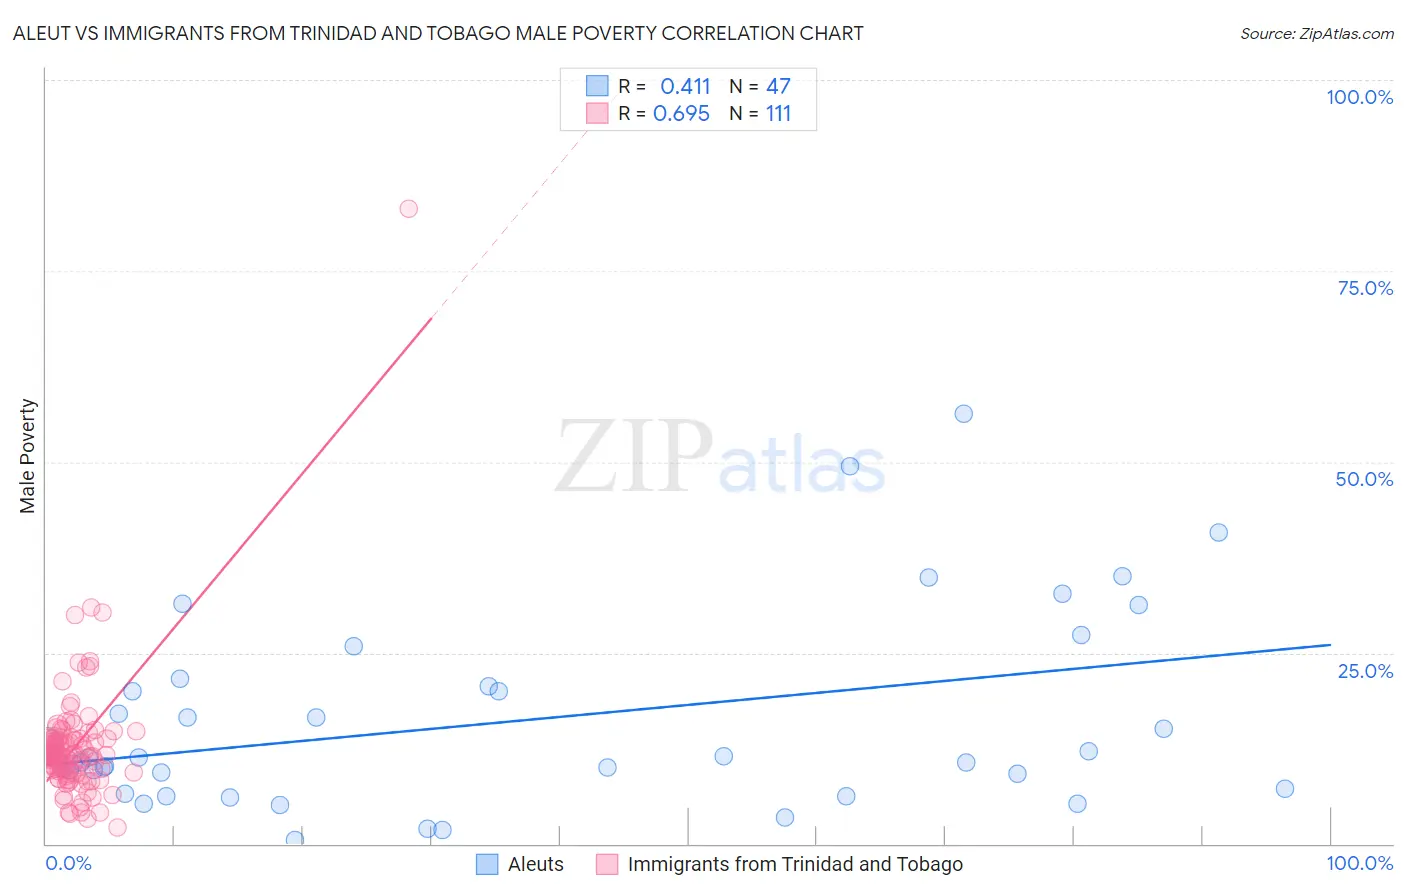
Aleut vs Immigrants from Trinidad and Tobago Male Poverty Correlation Chart
The statistical analysis conducted on geographies consisting of 61,774,316 people shows a moderate positive correlation between the proportion of Aleuts and poverty level among males in the United States with a correlation coefficient (R) of 0.411 and weighted average of 11.8%. Similarly, the statistical analysis conducted on geographies consisting of 223,466,412 people shows a significant positive correlation between the proportion of Immigrants from Trinidad and Tobago and poverty level among males in the United States with a correlation coefficient (R) of 0.695 and weighted average of 13.1%, a difference of 10.8%.
Male Poverty Correlation Summary
| Measurement | Aleut | Immigrants from Trinidad and Tobago |
| Minimum | 0.53% | 2.1% |
| Maximum | 56.2% | 83.2% |
| Range | 55.7% | 81.1% |
| Mean | 15.9% | 12.7% |
| Median | 11.2% | 11.6% |
| Interquartile 25% (IQ1) | 7.1% | 9.3% |
| Interquartile 75% (IQ3) | 20.6% | 13.7% |
| Interquartile Range (IQR) | 13.5% | 4.4% |
| Standard Deviation (Sample) | 12.6% | 8.4% |
| Standard Deviation (Population) | 12.4% | 8.4% |
Similar Demographics by Male Poverty
Demographics Similar to Aleuts by Male Poverty
In terms of male poverty, the demographic groups most similar to Aleuts are Immigrants from Western Asia (11.8%, a difference of 0.14%), Immigrants from Uganda (11.8%, a difference of 0.50%), Spaniard (11.7%, a difference of 0.71%), Immigrants from Lebanon (11.7%, a difference of 0.72%), and Spanish (11.7%, a difference of 0.82%).
| Demographics | Rating | Rank | Male Poverty |
| Arabs | 15.8 /100 | #195 | Poor 11.6% |
| Hmong | 15.8 /100 | #196 | Poor 11.6% |
| Delaware | 15.4 /100 | #197 | Poor 11.7% |
| Iraqis | 14.7 /100 | #198 | Poor 11.7% |
| Spanish | 14.1 /100 | #199 | Poor 11.7% |
| Immigrants | Lebanon | 13.6 /100 | #200 | Poor 11.7% |
| Spaniards | 13.5 /100 | #201 | Poor 11.7% |
| Aleuts | 10.4 /100 | #202 | Poor 11.8% |
| Immigrants | Western Asia | 9.8 /100 | #203 | Tragic 11.8% |
| Immigrants | Uganda | 8.5 /100 | #204 | Tragic 11.8% |
| Panamanians | 6.2 /100 | #205 | Tragic 11.9% |
| Immigrants | Eastern Africa | 5.4 /100 | #206 | Tragic 12.0% |
| Malaysians | 5.2 /100 | #207 | Tragic 12.0% |
| Immigrants | Immigrants | 4.5 /100 | #208 | Tragic 12.0% |
| Immigrants | Azores | 4.3 /100 | #209 | Tragic 12.0% |
Demographics Similar to Immigrants from Trinidad and Tobago by Male Poverty
In terms of male poverty, the demographic groups most similar to Immigrants from Trinidad and Tobago are Cape Verdean (13.1%, a difference of 0.13%), Immigrants from Burma/Myanmar (13.0%, a difference of 0.26%), Cherokee (13.1%, a difference of 0.29%), Ottawa (13.1%, a difference of 0.40%), and Trinidadian and Tobagonian (13.1%, a difference of 0.42%).
| Demographics | Rating | Rank | Male Poverty |
| Immigrants | Nicaragua | 0.2 /100 | #250 | Tragic 12.9% |
| Immigrants | Cuba | 0.2 /100 | #251 | Tragic 12.9% |
| Immigrants | Ecuador | 0.2 /100 | #252 | Tragic 12.9% |
| Immigrants | Ghana | 0.2 /100 | #253 | Tragic 12.9% |
| Mexican American Indians | 0.1 /100 | #254 | Tragic 13.0% |
| Immigrants | Liberia | 0.1 /100 | #255 | Tragic 13.0% |
| Immigrants | Burma/Myanmar | 0.1 /100 | #256 | Tragic 13.0% |
| Immigrants | Trinidad and Tobago | 0.1 /100 | #257 | Tragic 13.1% |
| Cape Verdeans | 0.1 /100 | #258 | Tragic 13.1% |
| Cherokee | 0.1 /100 | #259 | Tragic 13.1% |
| Ottawa | 0.1 /100 | #260 | Tragic 13.1% |
| Trinidadians and Tobagonians | 0.1 /100 | #261 | Tragic 13.1% |
| Spanish American Indians | 0.1 /100 | #262 | Tragic 13.1% |
| Central Americans | 0.1 /100 | #263 | Tragic 13.2% |
| Iroquois | 0.1 /100 | #264 | Tragic 13.2% |