Irish vs Immigrants from Barbados Poverty
COMPARE
Irish
Immigrants from Barbados
Poverty
Poverty Comparison
Irish
Immigrants from Barbados
11.3%
POVERTY
96.6/ 100
METRIC RATING
81st/ 347
METRIC RANK
14.9%
POVERTY
0.0/ 100
METRIC RATING
281st/ 347
METRIC RANK
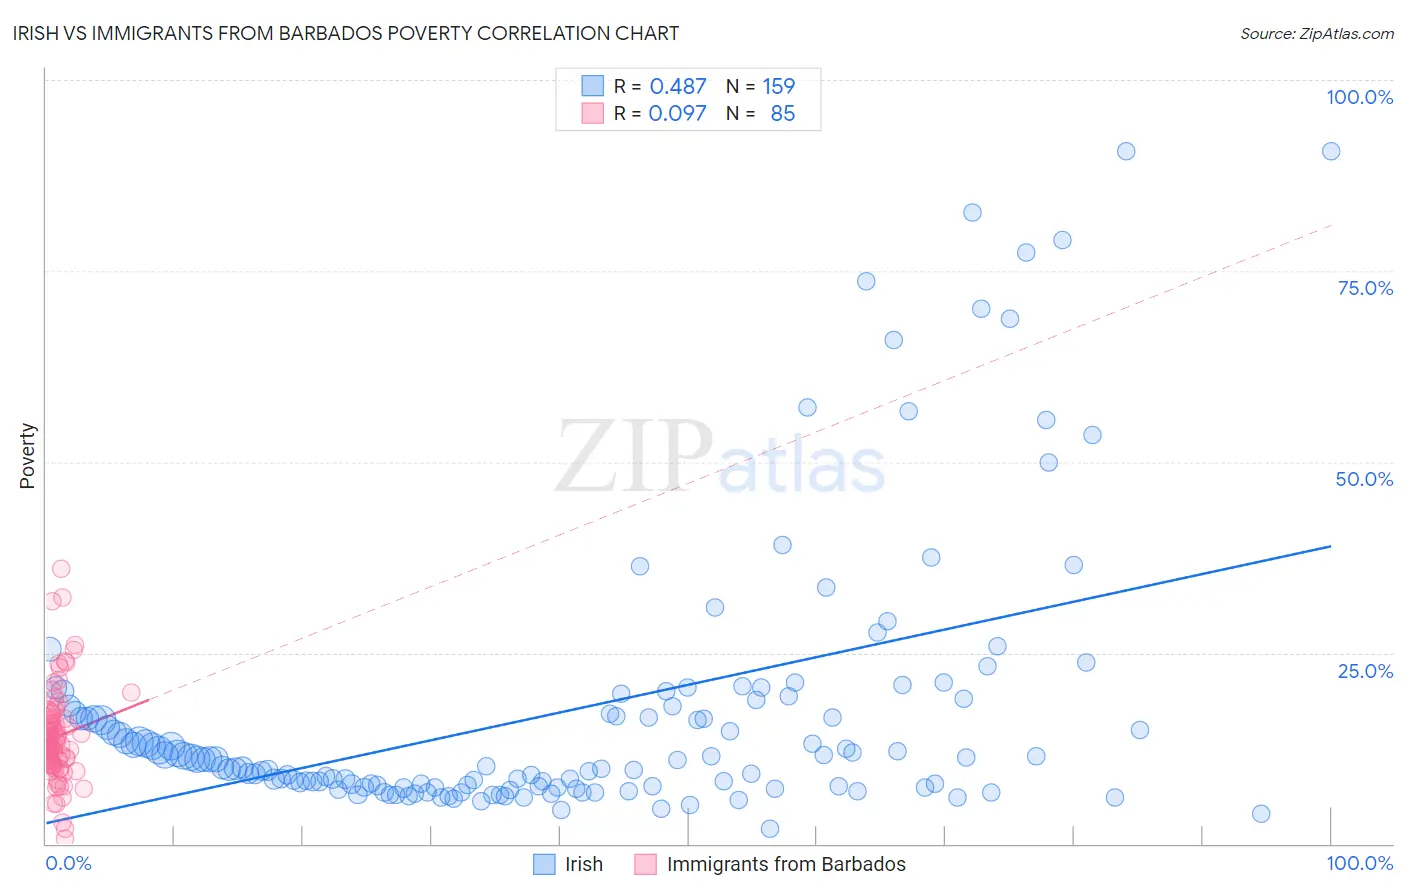
Irish vs Immigrants from Barbados Poverty Correlation Chart
The statistical analysis conducted on geographies consisting of 579,456,030 people shows a moderate positive correlation between the proportion of Irish and poverty level in the United States with a correlation coefficient (R) of 0.487 and weighted average of 11.3%. Similarly, the statistical analysis conducted on geographies consisting of 112,771,584 people shows a slight positive correlation between the proportion of Immigrants from Barbados and poverty level in the United States with a correlation coefficient (R) of 0.097 and weighted average of 14.9%, a difference of 31.7%.
Poverty Correlation Summary
| Measurement | Irish | Immigrants from Barbados |
| Minimum | 2.0% | 0.68% |
| Maximum | 90.7% | 36.1% |
| Range | 88.7% | 35.4% |
| Mean | 17.4% | 14.0% |
| Median | 11.0% | 13.2% |
| Interquartile 25% (IQ1) | 7.5% | 10.4% |
| Interquartile 75% (IQ3) | 18.1% | 16.4% |
| Interquartile Range (IQR) | 10.6% | 6.0% |
| Standard Deviation (Sample) | 18.1% | 6.2% |
| Standard Deviation (Population) | 18.0% | 6.2% |
Similar Demographics by Poverty
Demographics Similar to Irish by Poverty
In terms of poverty, the demographic groups most similar to Irish are Indian (Asian) (11.3%, a difference of 0.0%), Cambodian (11.3%, a difference of 0.020%), Dutch (11.3%, a difference of 0.070%), Immigrants from Eastern Asia (11.3%, a difference of 0.080%), and Egyptian (11.3%, a difference of 0.090%).
| Demographics | Rating | Rank | Poverty |
| Carpatho Rusyns | 97.2 /100 | #74 | Exceptional 11.3% |
| Immigrants | Eastern Europe | 97.0 /100 | #75 | Exceptional 11.3% |
| Immigrants | North America | 96.8 /100 | #76 | Exceptional 11.3% |
| Immigrants | Eastern Asia | 96.7 /100 | #77 | Exceptional 11.3% |
| Dutch | 96.7 /100 | #78 | Exceptional 11.3% |
| Cambodians | 96.7 /100 | #79 | Exceptional 11.3% |
| Indians (Asian) | 96.6 /100 | #80 | Exceptional 11.3% |
| Irish | 96.6 /100 | #81 | Exceptional 11.3% |
| Egyptians | 96.5 /100 | #82 | Exceptional 11.3% |
| Immigrants | Sweden | 96.3 /100 | #83 | Exceptional 11.3% |
| English | 96.3 /100 | #84 | Exceptional 11.3% |
| Immigrants | England | 96.2 /100 | #85 | Exceptional 11.4% |
| Jordanians | 96.0 /100 | #86 | Exceptional 11.4% |
| Northern Europeans | 96.0 /100 | #87 | Exceptional 11.4% |
| Belgians | 95.8 /100 | #88 | Exceptional 11.4% |
Demographics Similar to Immigrants from Barbados by Poverty
In terms of poverty, the demographic groups most similar to Immigrants from Barbados are Haitian (14.9%, a difference of 0.070%), Immigrants from St. Vincent and the Grenadines (14.9%, a difference of 0.27%), Comanche (15.0%, a difference of 0.33%), Immigrants from Haiti (15.0%, a difference of 0.45%), and West Indian (15.0%, a difference of 0.55%).
| Demographics | Rating | Rank | Poverty |
| Barbadians | 0.0 /100 | #274 | Tragic 14.8% |
| Immigrants | West Indies | 0.0 /100 | #275 | Tragic 14.8% |
| Immigrants | Bahamas | 0.0 /100 | #276 | Tragic 14.8% |
| Bangladeshis | 0.0 /100 | #277 | Tragic 14.8% |
| Belizeans | 0.0 /100 | #278 | Tragic 14.8% |
| Immigrants | St. Vincent and the Grenadines | 0.0 /100 | #279 | Tragic 14.9% |
| Haitians | 0.0 /100 | #280 | Tragic 14.9% |
| Immigrants | Barbados | 0.0 /100 | #281 | Tragic 14.9% |
| Comanche | 0.0 /100 | #282 | Tragic 15.0% |
| Immigrants | Haiti | 0.0 /100 | #283 | Tragic 15.0% |
| West Indians | 0.0 /100 | #284 | Tragic 15.0% |
| Vietnamese | 0.0 /100 | #285 | Tragic 15.0% |
| Immigrants | Latin America | 0.0 /100 | #286 | Tragic 15.0% |
| Inupiat | 0.0 /100 | #287 | Tragic 15.1% |
| Yaqui | 0.0 /100 | #288 | Tragic 15.1% |