Aleut vs Immigrants from Barbados Divorced or Separated
COMPARE
Aleut
Immigrants from Barbados
Divorced or Separated
Divorced or Separated Comparison
Aleuts
Immigrants from Barbados
12.5%
DIVORCED OR SEPARATED
1.3/ 100
METRIC RATING
251st/ 347
METRIC RANK
12.0%
DIVORCED OR SEPARATED
66.0/ 100
METRIC RATING
159th/ 347
METRIC RANK
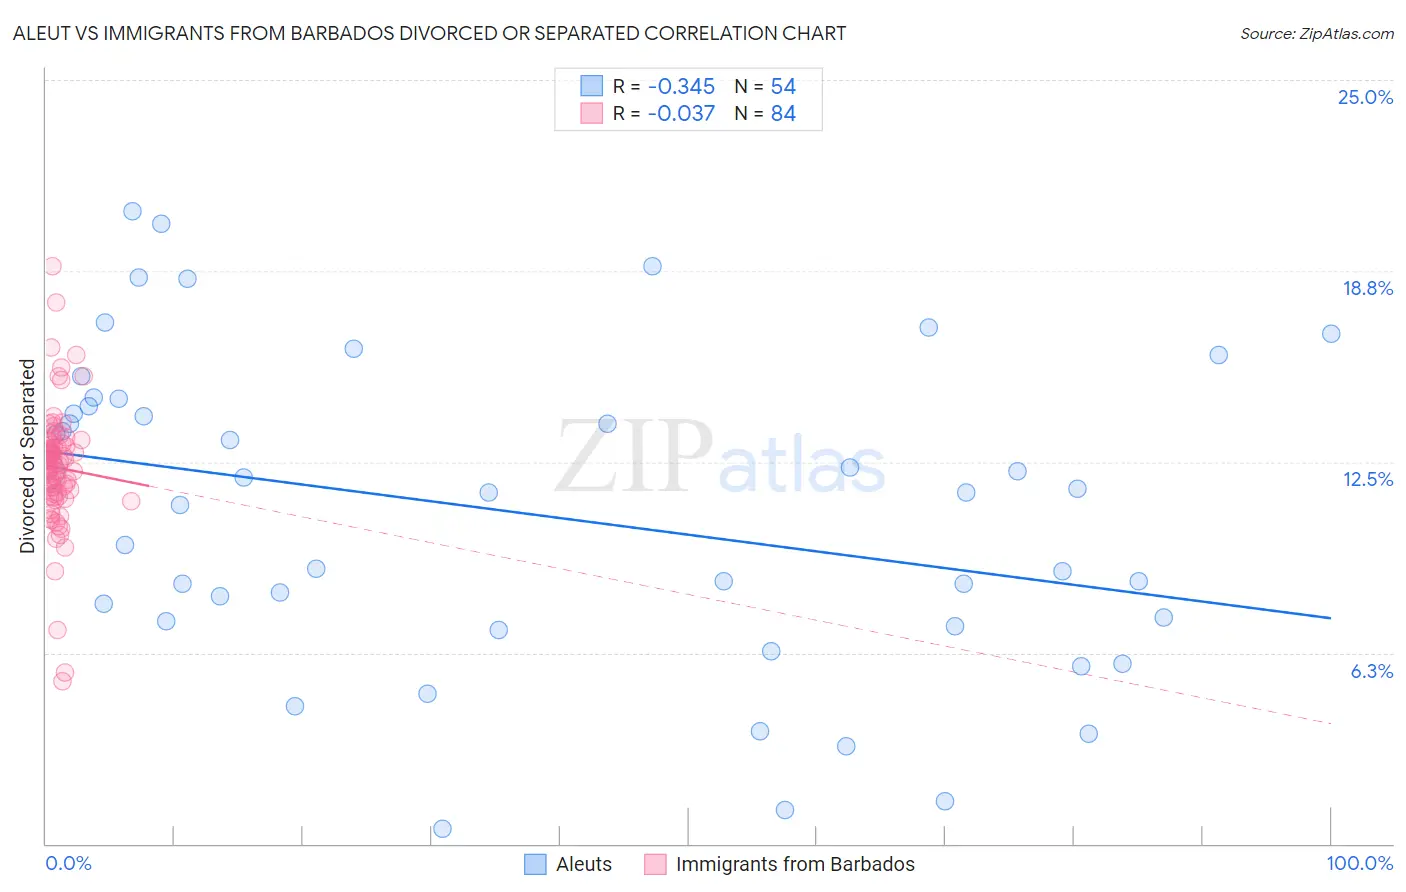
Aleut vs Immigrants from Barbados Divorced or Separated Correlation Chart
The statistical analysis conducted on geographies consisting of 61,777,142 people shows a mild negative correlation between the proportion of Aleuts and percentage of population currently divorced or separated in the United States with a correlation coefficient (R) of -0.345 and weighted average of 12.5%. Similarly, the statistical analysis conducted on geographies consisting of 112,765,917 people shows no correlation between the proportion of Immigrants from Barbados and percentage of population currently divorced or separated in the United States with a correlation coefficient (R) of -0.037 and weighted average of 12.0%, a difference of 4.4%.
Divorced or Separated Correlation Summary
| Measurement | Aleut | Immigrants from Barbados |
| Minimum | 0.50% | 5.3% |
| Maximum | 20.7% | 18.9% |
| Range | 20.2% | 13.6% |
| Mean | 10.8% | 12.3% |
| Median | 11.5% | 12.4% |
| Interquartile 25% (IQ1) | 7.3% | 11.4% |
| Interquartile 75% (IQ3) | 14.3% | 13.1% |
| Interquartile Range (IQR) | 7.0% | 1.6% |
| Standard Deviation (Sample) | 5.1% | 2.0% |
| Standard Deviation (Population) | 5.0% | 2.0% |
Similar Demographics by Divorced or Separated
Demographics Similar to Aleuts by Divorced or Separated
In terms of divorced or separated, the demographic groups most similar to Aleuts are Irish (12.5%, a difference of 0.0%), Finnish (12.5%, a difference of 0.28%), Nepalese (12.5%, a difference of 0.29%), German (12.5%, a difference of 0.31%), and Liberian (12.6%, a difference of 0.33%).
| Demographics | Rating | Rank | Divorced or Separated |
| Alaska Natives | 2.5 /100 | #244 | Tragic 12.4% |
| Hispanics or Latinos | 2.0 /100 | #245 | Tragic 12.5% |
| Immigrants | West Indies | 1.9 /100 | #246 | Tragic 12.5% |
| Germans | 1.8 /100 | #247 | Tragic 12.5% |
| Nepalese | 1.8 /100 | #248 | Tragic 12.5% |
| Finns | 1.8 /100 | #249 | Tragic 12.5% |
| Irish | 1.3 /100 | #250 | Tragic 12.5% |
| Aleuts | 1.3 /100 | #251 | Tragic 12.5% |
| Liberians | 0.9 /100 | #252 | Tragic 12.6% |
| Somalis | 0.9 /100 | #253 | Tragic 12.6% |
| Senegalese | 0.8 /100 | #254 | Tragic 12.6% |
| Welsh | 0.7 /100 | #255 | Tragic 12.6% |
| Immigrants | Colombia | 0.6 /100 | #256 | Tragic 12.6% |
| Immigrants | Somalia | 0.6 /100 | #257 | Tragic 12.6% |
| Indonesians | 0.6 /100 | #258 | Tragic 12.6% |
Demographics Similar to Immigrants from Barbados by Divorced or Separated
In terms of divorced or separated, the demographic groups most similar to Immigrants from Barbados are Icelander (12.0%, a difference of 0.0%), Immigrants from Scotland (12.0%, a difference of 0.010%), Marshallese (12.0%, a difference of 0.050%), Samoan (12.0%, a difference of 0.070%), and Navajo (12.0%, a difference of 0.080%).
| Demographics | Rating | Rank | Divorced or Separated |
| Immigrants | Hungary | 73.7 /100 | #152 | Good 11.9% |
| Austrians | 72.2 /100 | #153 | Good 12.0% |
| Chileans | 71.3 /100 | #154 | Good 12.0% |
| Japanese | 70.9 /100 | #155 | Good 12.0% |
| Hungarians | 70.3 /100 | #156 | Good 12.0% |
| Immigrants | Brazil | 68.8 /100 | #157 | Good 12.0% |
| Icelanders | 66.0 /100 | #158 | Good 12.0% |
| Immigrants | Barbados | 66.0 /100 | #159 | Good 12.0% |
| Immigrants | Scotland | 65.8 /100 | #160 | Good 12.0% |
| Marshallese | 64.6 /100 | #161 | Good 12.0% |
| Samoans | 64.3 /100 | #162 | Good 12.0% |
| Navajo | 63.9 /100 | #163 | Good 12.0% |
| Swiss | 63.6 /100 | #164 | Good 12.0% |
| German Russians | 61.8 /100 | #165 | Good 12.0% |
| Tohono O'odham | 60.4 /100 | #166 | Good 12.0% |