Alaskan Athabascan vs Macedonian Poverty
COMPARE
Alaskan Athabascan
Macedonian
Poverty
Poverty Comparison
Alaskan Athabascans
Macedonians
13.6%
POVERTY
1.5/ 100
METRIC RATING
230th/ 347
METRIC RANK
10.8%
POVERTY
99.4/ 100
METRIC RATING
33rd/ 347
METRIC RANK
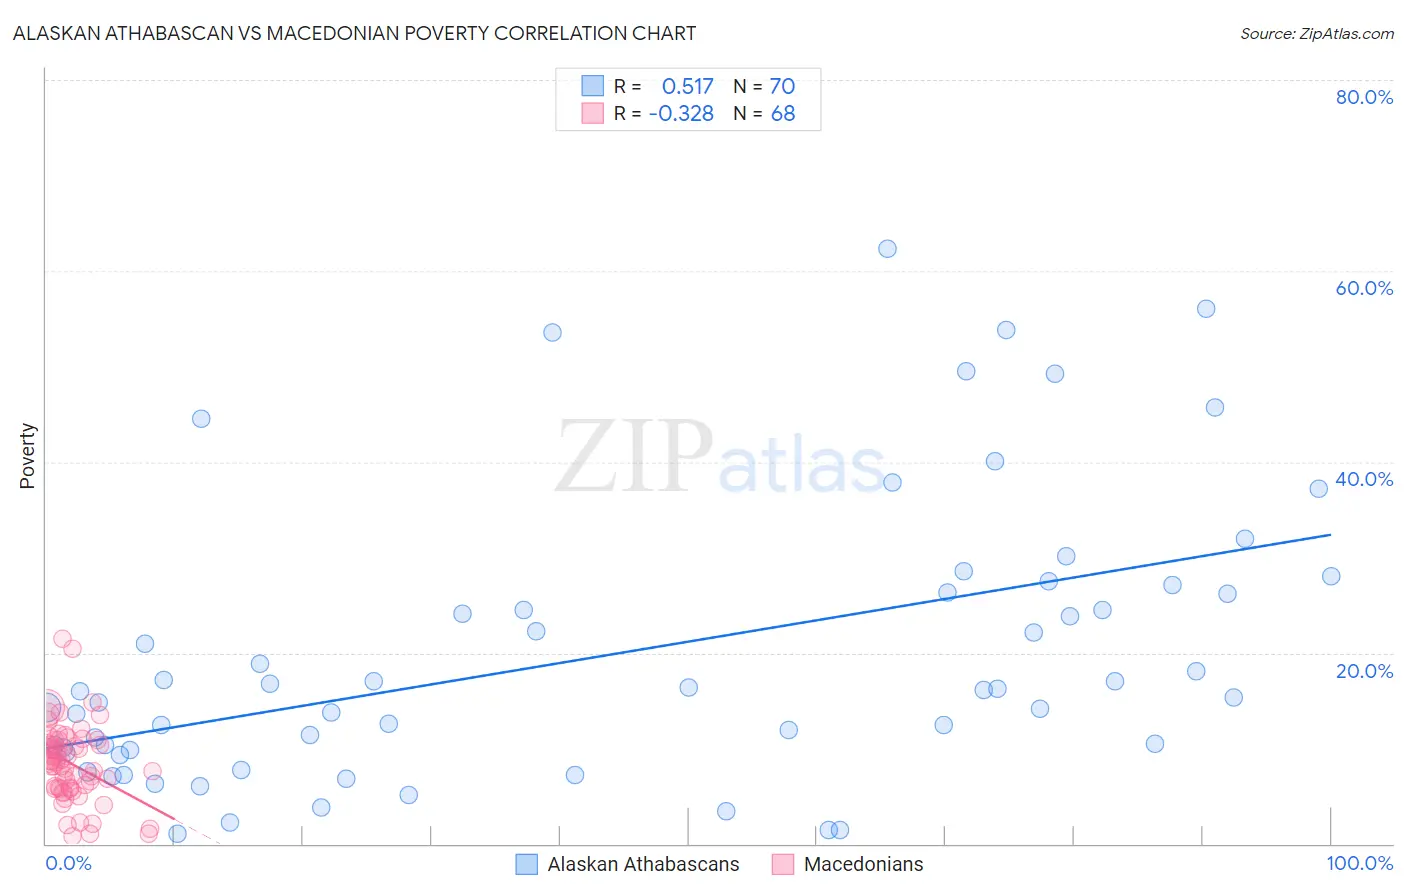
Alaskan Athabascan vs Macedonian Poverty Correlation Chart
The statistical analysis conducted on geographies consisting of 45,813,239 people shows a substantial positive correlation between the proportion of Alaskan Athabascans and poverty level in the United States with a correlation coefficient (R) of 0.517 and weighted average of 13.6%. Similarly, the statistical analysis conducted on geographies consisting of 132,607,264 people shows a mild negative correlation between the proportion of Macedonians and poverty level in the United States with a correlation coefficient (R) of -0.328 and weighted average of 10.8%, a difference of 25.7%.
Poverty Correlation Summary
| Measurement | Alaskan Athabascan | Macedonian |
| Minimum | 1.1% | 0.75% |
| Maximum | 62.3% | 21.4% |
| Range | 61.2% | 20.7% |
| Mean | 19.9% | 8.4% |
| Median | 16.0% | 8.5% |
| Interquartile 25% (IQ1) | 9.8% | 5.8% |
| Interquartile 75% (IQ3) | 26.3% | 10.7% |
| Interquartile Range (IQR) | 16.5% | 4.9% |
| Standard Deviation (Sample) | 14.7% | 4.0% |
| Standard Deviation (Population) | 14.6% | 4.0% |
Similar Demographics by Poverty
Demographics Similar to Alaskan Athabascans by Poverty
In terms of poverty, the demographic groups most similar to Alaskan Athabascans are Osage (13.6%, a difference of 0.060%), Nigerian (13.6%, a difference of 0.17%), Immigrants from Nigeria (13.5%, a difference of 0.30%), Alaska Native (13.5%, a difference of 0.75%), and Marshallese (13.4%, a difference of 0.90%).
| Demographics | Rating | Rank | Poverty |
| Immigrants | Africa | 2.5 /100 | #223 | Tragic 13.4% |
| Immigrants | Eritrea | 2.4 /100 | #224 | Tragic 13.4% |
| German Russians | 2.2 /100 | #225 | Tragic 13.4% |
| Marshallese | 2.2 /100 | #226 | Tragic 13.4% |
| Alaska Natives | 2.1 /100 | #227 | Tragic 13.5% |
| Immigrants | Nigeria | 1.7 /100 | #228 | Tragic 13.5% |
| Osage | 1.5 /100 | #229 | Tragic 13.6% |
| Alaskan Athabascans | 1.5 /100 | #230 | Tragic 13.6% |
| Nigerians | 1.4 /100 | #231 | Tragic 13.6% |
| Fijians | 0.8 /100 | #232 | Tragic 13.7% |
| Immigrants | Saudi Arabia | 0.8 /100 | #233 | Tragic 13.8% |
| Immigrants | Laos | 0.7 /100 | #234 | Tragic 13.8% |
| Cubans | 0.6 /100 | #235 | Tragic 13.9% |
| Immigrants | Armenia | 0.5 /100 | #236 | Tragic 13.9% |
| French American Indians | 0.5 /100 | #237 | Tragic 13.9% |
Demographics Similar to Macedonians by Poverty
In terms of poverty, the demographic groups most similar to Macedonians are Immigrants from Poland (10.8%, a difference of 0.090%), Tongan (10.8%, a difference of 0.14%), Cypriot (10.8%, a difference of 0.21%), Immigrants from Greece (10.8%, a difference of 0.31%), and Czech (10.8%, a difference of 0.36%).
| Demographics | Rating | Rank | Poverty |
| Burmese | 99.6 /100 | #26 | Exceptional 10.7% |
| Immigrants | Northern Europe | 99.6 /100 | #27 | Exceptional 10.7% |
| Immigrants | Korea | 99.5 /100 | #28 | Exceptional 10.7% |
| Greeks | 99.5 /100 | #29 | Exceptional 10.7% |
| Danes | 99.5 /100 | #30 | Exceptional 10.7% |
| Poles | 99.5 /100 | #31 | Exceptional 10.7% |
| Iranians | 99.5 /100 | #32 | Exceptional 10.7% |
| Macedonians | 99.4 /100 | #33 | Exceptional 10.8% |
| Immigrants | Poland | 99.4 /100 | #34 | Exceptional 10.8% |
| Tongans | 99.4 /100 | #35 | Exceptional 10.8% |
| Cypriots | 99.3 /100 | #36 | Exceptional 10.8% |
| Immigrants | Greece | 99.3 /100 | #37 | Exceptional 10.8% |
| Czechs | 99.3 /100 | #38 | Exceptional 10.8% |
| Immigrants | Pakistan | 99.3 /100 | #39 | Exceptional 10.8% |
| Russians | 99.3 /100 | #40 | Exceptional 10.9% |