Alaskan Athabascan vs Syrian Poverty
COMPARE
Alaskan Athabascan
Syrian
Poverty
Poverty Comparison
Alaskan Athabascans
Syrians
13.6%
POVERTY
1.5/ 100
METRIC RATING
230th/ 347
METRIC RANK
12.0%
POVERTY
75.1/ 100
METRIC RATING
145th/ 347
METRIC RANK
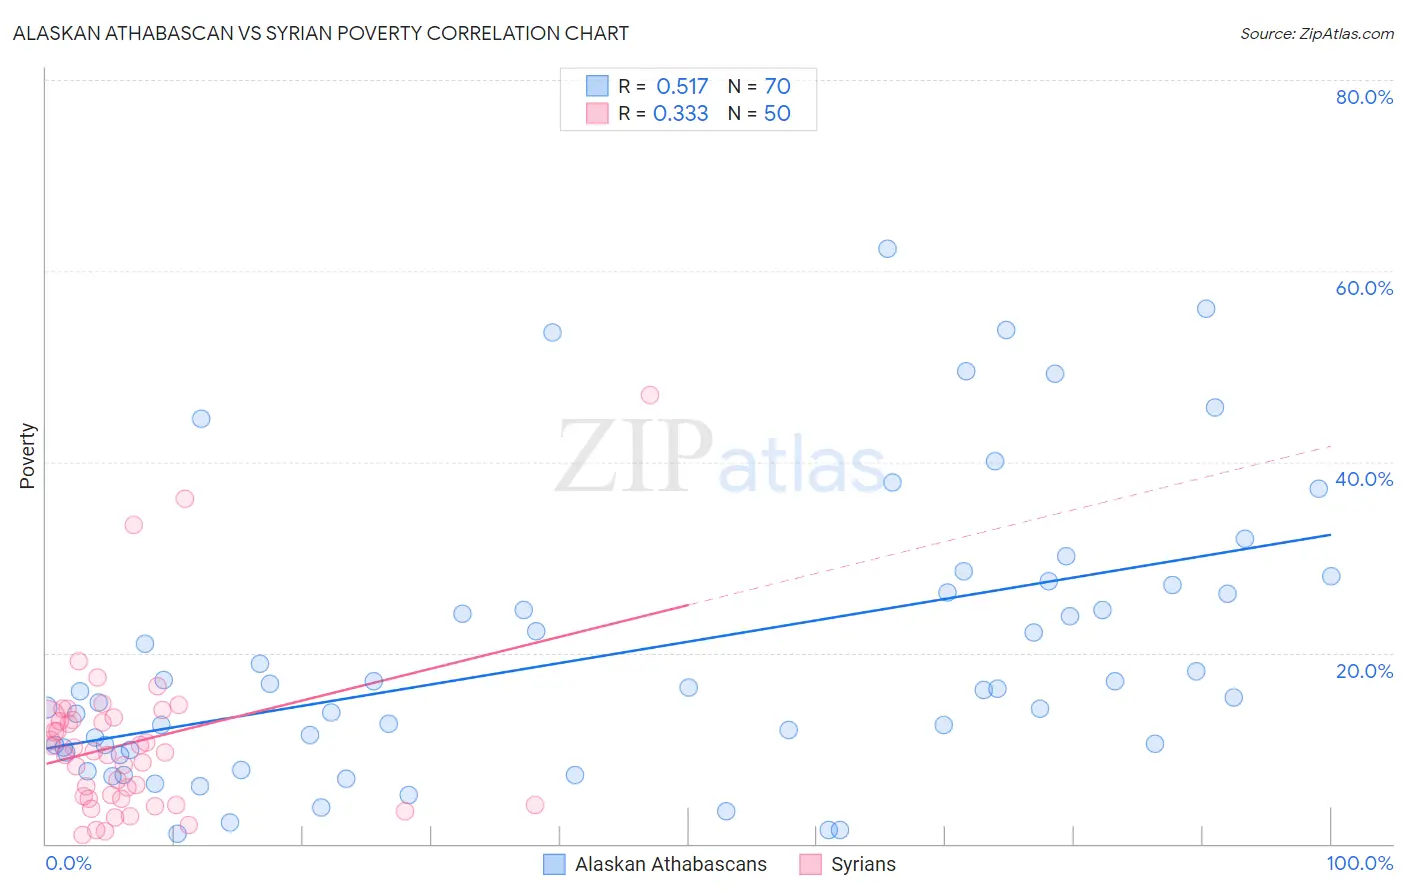
Alaskan Athabascan vs Syrian Poverty Correlation Chart
The statistical analysis conducted on geographies consisting of 45,813,239 people shows a substantial positive correlation between the proportion of Alaskan Athabascans and poverty level in the United States with a correlation coefficient (R) of 0.517 and weighted average of 13.6%. Similarly, the statistical analysis conducted on geographies consisting of 266,206,750 people shows a mild positive correlation between the proportion of Syrians and poverty level in the United States with a correlation coefficient (R) of 0.333 and weighted average of 12.0%, a difference of 13.2%.
Poverty Correlation Summary
| Measurement | Alaskan Athabascan | Syrian |
| Minimum | 1.1% | 0.89% |
| Maximum | 62.3% | 47.0% |
| Range | 61.2% | 46.1% |
| Mean | 19.9% | 10.6% |
| Median | 16.0% | 9.6% |
| Interquartile 25% (IQ1) | 9.8% | 4.8% |
| Interquartile 75% (IQ3) | 26.3% | 13.0% |
| Interquartile Range (IQR) | 16.5% | 8.3% |
| Standard Deviation (Sample) | 14.7% | 8.7% |
| Standard Deviation (Population) | 14.6% | 8.6% |
Similar Demographics by Poverty
Demographics Similar to Alaskan Athabascans by Poverty
In terms of poverty, the demographic groups most similar to Alaskan Athabascans are Osage (13.6%, a difference of 0.060%), Nigerian (13.6%, a difference of 0.17%), Immigrants from Nigeria (13.5%, a difference of 0.30%), Alaska Native (13.5%, a difference of 0.75%), and Marshallese (13.4%, a difference of 0.90%).
| Demographics | Rating | Rank | Poverty |
| Immigrants | Africa | 2.5 /100 | #223 | Tragic 13.4% |
| Immigrants | Eritrea | 2.4 /100 | #224 | Tragic 13.4% |
| German Russians | 2.2 /100 | #225 | Tragic 13.4% |
| Marshallese | 2.2 /100 | #226 | Tragic 13.4% |
| Alaska Natives | 2.1 /100 | #227 | Tragic 13.5% |
| Immigrants | Nigeria | 1.7 /100 | #228 | Tragic 13.5% |
| Osage | 1.5 /100 | #229 | Tragic 13.6% |
| Alaskan Athabascans | 1.5 /100 | #230 | Tragic 13.6% |
| Nigerians | 1.4 /100 | #231 | Tragic 13.6% |
| Fijians | 0.8 /100 | #232 | Tragic 13.7% |
| Immigrants | Saudi Arabia | 0.8 /100 | #233 | Tragic 13.8% |
| Immigrants | Laos | 0.7 /100 | #234 | Tragic 13.8% |
| Cubans | 0.6 /100 | #235 | Tragic 13.9% |
| Immigrants | Armenia | 0.5 /100 | #236 | Tragic 13.9% |
| French American Indians | 0.5 /100 | #237 | Tragic 13.9% |
Demographics Similar to Syrians by Poverty
In terms of poverty, the demographic groups most similar to Syrians are Afghan (12.0%, a difference of 0.030%), Immigrants from Bosnia and Herzegovina (12.0%, a difference of 0.19%), Immigrants from Germany (12.0%, a difference of 0.31%), Immigrants from Malaysia (12.0%, a difference of 0.32%), and Immigrants from Kazakhstan (12.0%, a difference of 0.37%).
| Demographics | Rating | Rank | Poverty |
| Immigrants | Jordan | 82.4 /100 | #138 | Excellent 11.9% |
| Pakistanis | 82.2 /100 | #139 | Excellent 11.9% |
| Immigrants | Peru | 81.1 /100 | #140 | Excellent 11.9% |
| Immigrants | France | 80.5 /100 | #141 | Excellent 11.9% |
| Basques | 80.4 /100 | #142 | Excellent 11.9% |
| Brazilians | 79.7 /100 | #143 | Good 11.9% |
| Icelanders | 77.9 /100 | #144 | Good 11.9% |
| Syrians | 75.1 /100 | #145 | Good 12.0% |
| Afghans | 74.9 /100 | #146 | Good 12.0% |
| Immigrants | Bosnia and Herzegovina | 73.7 /100 | #147 | Good 12.0% |
| Immigrants | Germany | 72.7 /100 | #148 | Good 12.0% |
| Immigrants | Malaysia | 72.7 /100 | #149 | Good 12.0% |
| Immigrants | Kazakhstan | 72.3 /100 | #150 | Good 12.0% |
| Samoans | 71.9 /100 | #151 | Good 12.0% |
| Armenians | 67.6 /100 | #152 | Good 12.1% |