Immigrants from Thailand vs Macedonian Poverty
COMPARE
Immigrants from Thailand
Macedonian
Poverty
Poverty Comparison
Immigrants from Thailand
Macedonians
13.3%
POVERTY
3.1/ 100
METRIC RATING
218th/ 347
METRIC RANK
10.8%
POVERTY
99.4/ 100
METRIC RATING
33rd/ 347
METRIC RANK
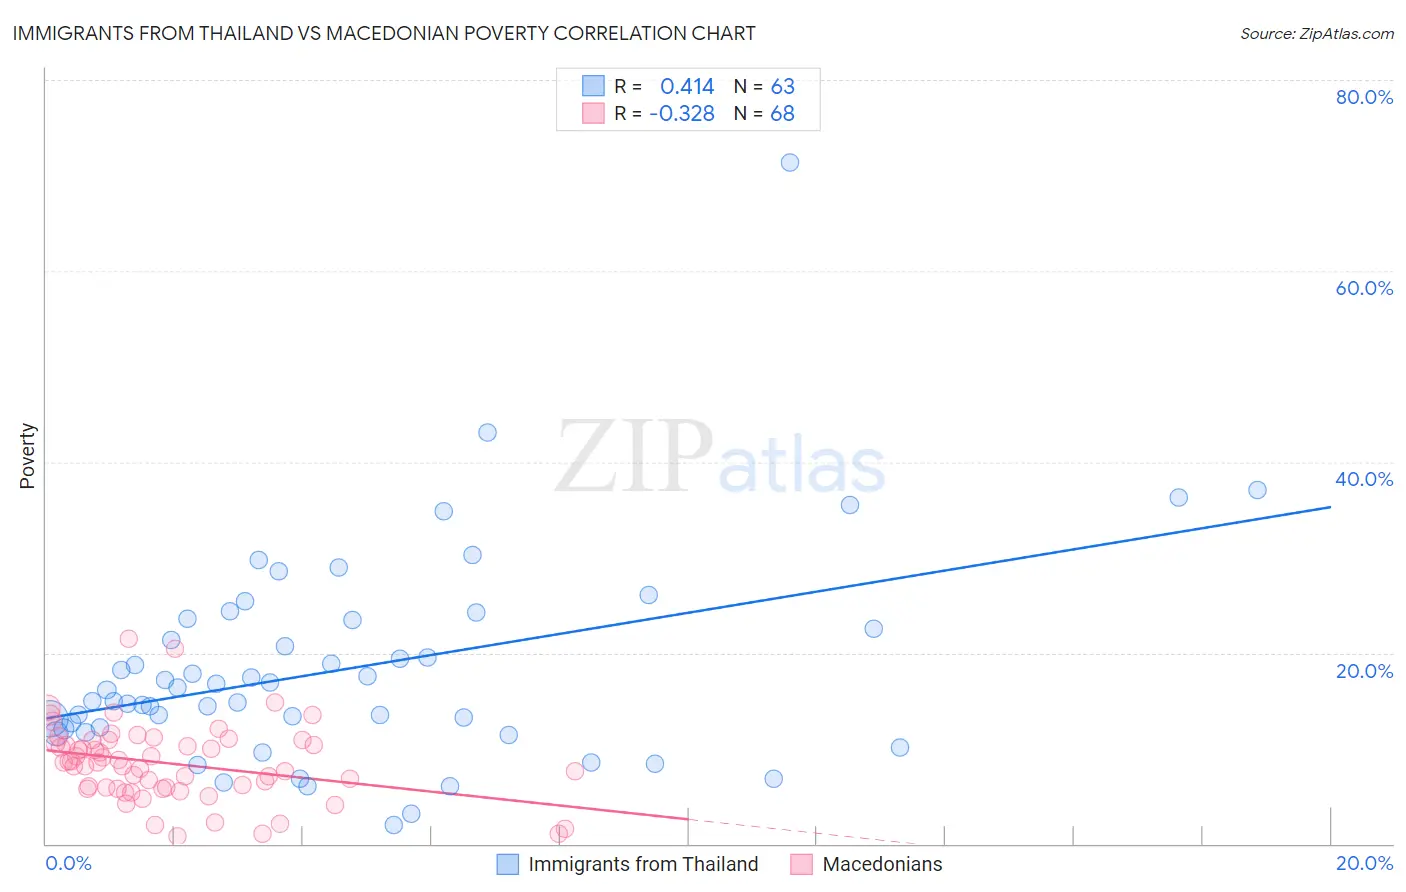
Immigrants from Thailand vs Macedonian Poverty Correlation Chart
The statistical analysis conducted on geographies consisting of 316,935,515 people shows a moderate positive correlation between the proportion of Immigrants from Thailand and poverty level in the United States with a correlation coefficient (R) of 0.414 and weighted average of 13.3%. Similarly, the statistical analysis conducted on geographies consisting of 132,607,264 people shows a mild negative correlation between the proportion of Macedonians and poverty level in the United States with a correlation coefficient (R) of -0.328 and weighted average of 10.8%, a difference of 23.5%.
Poverty Correlation Summary
| Measurement | Immigrants from Thailand | Macedonian |
| Minimum | 2.0% | 0.75% |
| Maximum | 71.4% | 21.4% |
| Range | 69.4% | 20.7% |
| Mean | 18.3% | 8.4% |
| Median | 16.1% | 8.5% |
| Interquartile 25% (IQ1) | 12.1% | 5.8% |
| Interquartile 75% (IQ3) | 23.4% | 10.7% |
| Interquartile Range (IQR) | 11.4% | 4.9% |
| Standard Deviation (Sample) | 11.1% | 4.0% |
| Standard Deviation (Population) | 11.0% | 4.0% |
Similar Demographics by Poverty
Demographics Similar to Immigrants from Thailand by Poverty
In terms of poverty, the demographic groups most similar to Immigrants from Thailand are Immigrants from Uzbekistan (13.3%, a difference of 0.060%), Japanese (13.3%, a difference of 0.10%), Nonimmigrants (13.3%, a difference of 0.10%), Immigrants from Cambodia (13.4%, a difference of 0.12%), and American (13.4%, a difference of 0.21%).
| Demographics | Rating | Rank | Poverty |
| Moroccans | 5.2 /100 | #211 | Tragic 13.2% |
| Immigrants | Immigrants | 4.3 /100 | #212 | Tragic 13.2% |
| Immigrants | Panama | 4.1 /100 | #213 | Tragic 13.3% |
| Bermudans | 3.7 /100 | #214 | Tragic 13.3% |
| Japanese | 3.3 /100 | #215 | Tragic 13.3% |
| Immigrants | Nonimmigrants | 3.3 /100 | #216 | Tragic 13.3% |
| Immigrants | Uzbekistan | 3.2 /100 | #217 | Tragic 13.3% |
| Immigrants | Thailand | 3.1 /100 | #218 | Tragic 13.3% |
| Immigrants | Cambodia | 3.0 /100 | #219 | Tragic 13.4% |
| Americans | 2.9 /100 | #220 | Tragic 13.4% |
| Alsatians | 2.6 /100 | #221 | Tragic 13.4% |
| Immigrants | Micronesia | 2.6 /100 | #222 | Tragic 13.4% |
| Immigrants | Africa | 2.5 /100 | #223 | Tragic 13.4% |
| Immigrants | Eritrea | 2.4 /100 | #224 | Tragic 13.4% |
| German Russians | 2.2 /100 | #225 | Tragic 13.4% |
Demographics Similar to Macedonians by Poverty
In terms of poverty, the demographic groups most similar to Macedonians are Immigrants from Poland (10.8%, a difference of 0.090%), Tongan (10.8%, a difference of 0.14%), Cypriot (10.8%, a difference of 0.21%), Immigrants from Greece (10.8%, a difference of 0.31%), and Czech (10.8%, a difference of 0.36%).
| Demographics | Rating | Rank | Poverty |
| Burmese | 99.6 /100 | #26 | Exceptional 10.7% |
| Immigrants | Northern Europe | 99.6 /100 | #27 | Exceptional 10.7% |
| Immigrants | Korea | 99.5 /100 | #28 | Exceptional 10.7% |
| Greeks | 99.5 /100 | #29 | Exceptional 10.7% |
| Danes | 99.5 /100 | #30 | Exceptional 10.7% |
| Poles | 99.5 /100 | #31 | Exceptional 10.7% |
| Iranians | 99.5 /100 | #32 | Exceptional 10.7% |
| Macedonians | 99.4 /100 | #33 | Exceptional 10.8% |
| Immigrants | Poland | 99.4 /100 | #34 | Exceptional 10.8% |
| Tongans | 99.4 /100 | #35 | Exceptional 10.8% |
| Cypriots | 99.3 /100 | #36 | Exceptional 10.8% |
| Immigrants | Greece | 99.3 /100 | #37 | Exceptional 10.8% |
| Czechs | 99.3 /100 | #38 | Exceptional 10.8% |
| Immigrants | Pakistan | 99.3 /100 | #39 | Exceptional 10.8% |
| Russians | 99.3 /100 | #40 | Exceptional 10.9% |