Immigrants from Japan vs Macedonian Poverty
COMPARE
Immigrants from Japan
Macedonian
Poverty
Poverty Comparison
Immigrants from Japan
Macedonians
11.0%
POVERTY
98.9/ 100
METRIC RATING
49th/ 347
METRIC RANK
10.8%
POVERTY
99.4/ 100
METRIC RATING
33rd/ 347
METRIC RANK
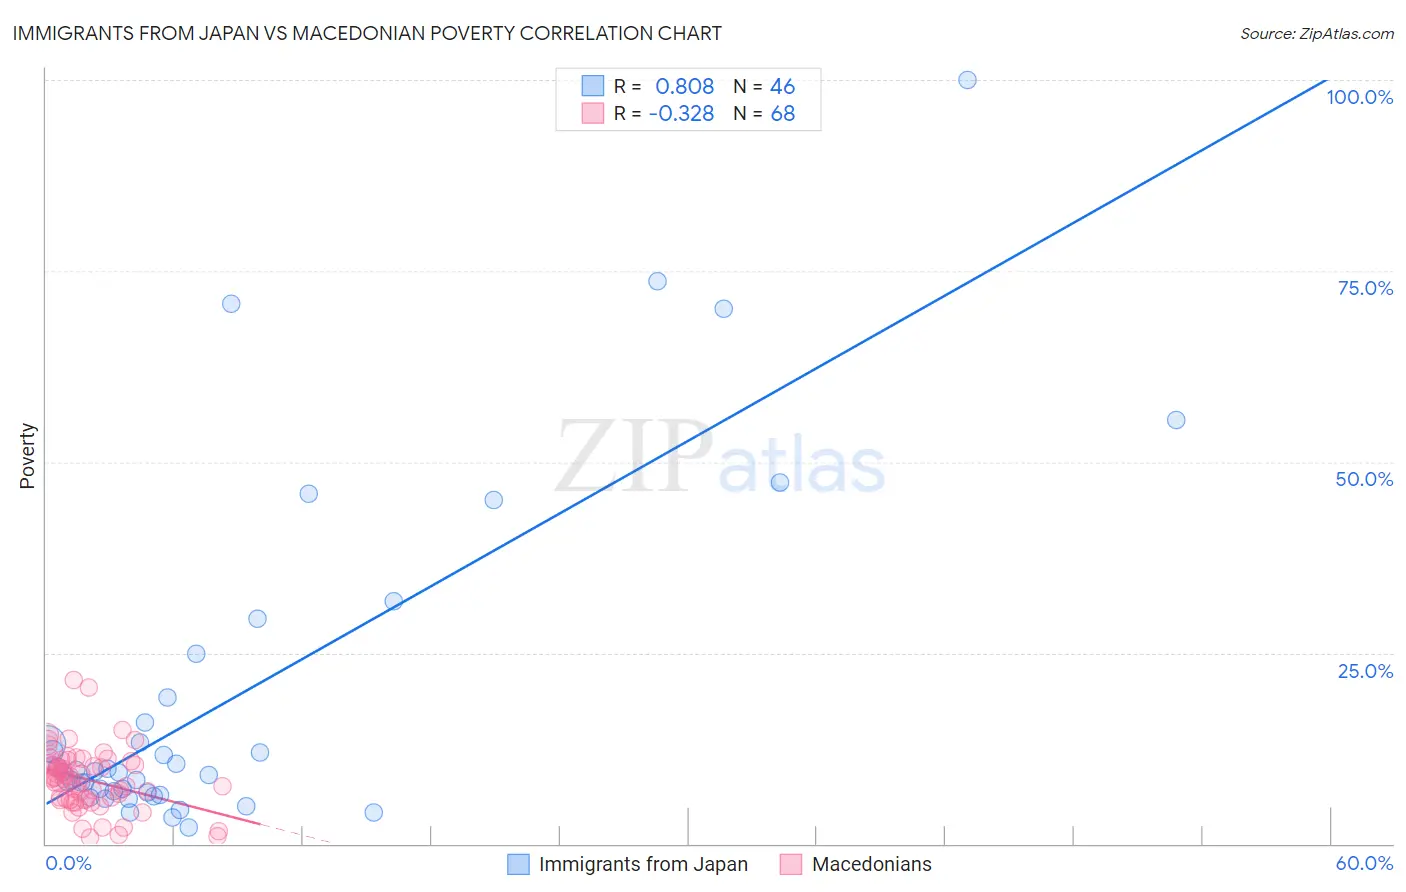
Immigrants from Japan vs Macedonian Poverty Correlation Chart
The statistical analysis conducted on geographies consisting of 340,013,080 people shows a very strong positive correlation between the proportion of Immigrants from Japan and poverty level in the United States with a correlation coefficient (R) of 0.808 and weighted average of 11.0%. Similarly, the statistical analysis conducted on geographies consisting of 132,607,264 people shows a mild negative correlation between the proportion of Macedonians and poverty level in the United States with a correlation coefficient (R) of -0.328 and weighted average of 10.8%, a difference of 1.7%.
Poverty Correlation Summary
| Measurement | Immigrants from Japan | Macedonian |
| Minimum | 2.0% | 0.75% |
| Maximum | 100.0% | 21.4% |
| Range | 98.0% | 20.7% |
| Mean | 19.4% | 8.4% |
| Median | 9.4% | 8.5% |
| Interquartile 25% (IQ1) | 6.6% | 5.8% |
| Interquartile 75% (IQ3) | 19.2% | 10.7% |
| Interquartile Range (IQR) | 12.6% | 4.9% |
| Standard Deviation (Sample) | 22.6% | 4.0% |
| Standard Deviation (Population) | 22.4% | 4.0% |
Demographics Similar to Immigrants from Japan and Macedonians by Poverty
In terms of poverty, the demographic groups most similar to Immigrants from Japan are Slovene (11.0%, a difference of 0.010%), Asian (11.0%, a difference of 0.030%), Immigrants from Romania (11.0%, a difference of 0.050%), Immigrants from Czechoslovakia (11.0%, a difference of 0.070%), and Turkish (11.0%, a difference of 0.15%). Similarly, the demographic groups most similar to Macedonians are Immigrants from Poland (10.8%, a difference of 0.090%), Tongan (10.8%, a difference of 0.14%), Cypriot (10.8%, a difference of 0.21%), Immigrants from Greece (10.8%, a difference of 0.31%), and Czech (10.8%, a difference of 0.36%).
| Demographics | Rating | Rank | Poverty |
| Poles | 99.5 /100 | #31 | Exceptional 10.7% |
| Iranians | 99.5 /100 | #32 | Exceptional 10.7% |
| Macedonians | 99.4 /100 | #33 | Exceptional 10.8% |
| Immigrants | Poland | 99.4 /100 | #34 | Exceptional 10.8% |
| Tongans | 99.4 /100 | #35 | Exceptional 10.8% |
| Cypriots | 99.3 /100 | #36 | Exceptional 10.8% |
| Immigrants | Greece | 99.3 /100 | #37 | Exceptional 10.8% |
| Czechs | 99.3 /100 | #38 | Exceptional 10.8% |
| Immigrants | Pakistan | 99.3 /100 | #39 | Exceptional 10.8% |
| Russians | 99.3 /100 | #40 | Exceptional 10.9% |
| Immigrants | Iran | 99.2 /100 | #41 | Exceptional 10.9% |
| Koreans | 99.2 /100 | #42 | Exceptional 10.9% |
| Immigrants | Singapore | 99.2 /100 | #43 | Exceptional 10.9% |
| Immigrants | Moldova | 99.1 /100 | #44 | Exceptional 10.9% |
| Turks | 98.9 /100 | #45 | Exceptional 11.0% |
| Immigrants | Czechoslovakia | 98.9 /100 | #46 | Exceptional 11.0% |
| Immigrants | Romania | 98.9 /100 | #47 | Exceptional 11.0% |
| Slovenes | 98.9 /100 | #48 | Exceptional 11.0% |
| Immigrants | Japan | 98.9 /100 | #49 | Exceptional 11.0% |
| Asians | 98.9 /100 | #50 | Exceptional 11.0% |
| Immigrants | Croatia | 98.7 /100 | #51 | Exceptional 11.0% |