Alaskan Athabascan vs Bahamian Poverty
COMPARE
Alaskan Athabascan
Bahamian
Poverty
Poverty Comparison
Alaskan Athabascans
Bahamians
13.6%
POVERTY
1.5/ 100
METRIC RATING
230th/ 347
METRIC RANK
15.4%
POVERTY
0.0/ 100
METRIC RATING
301st/ 347
METRIC RANK
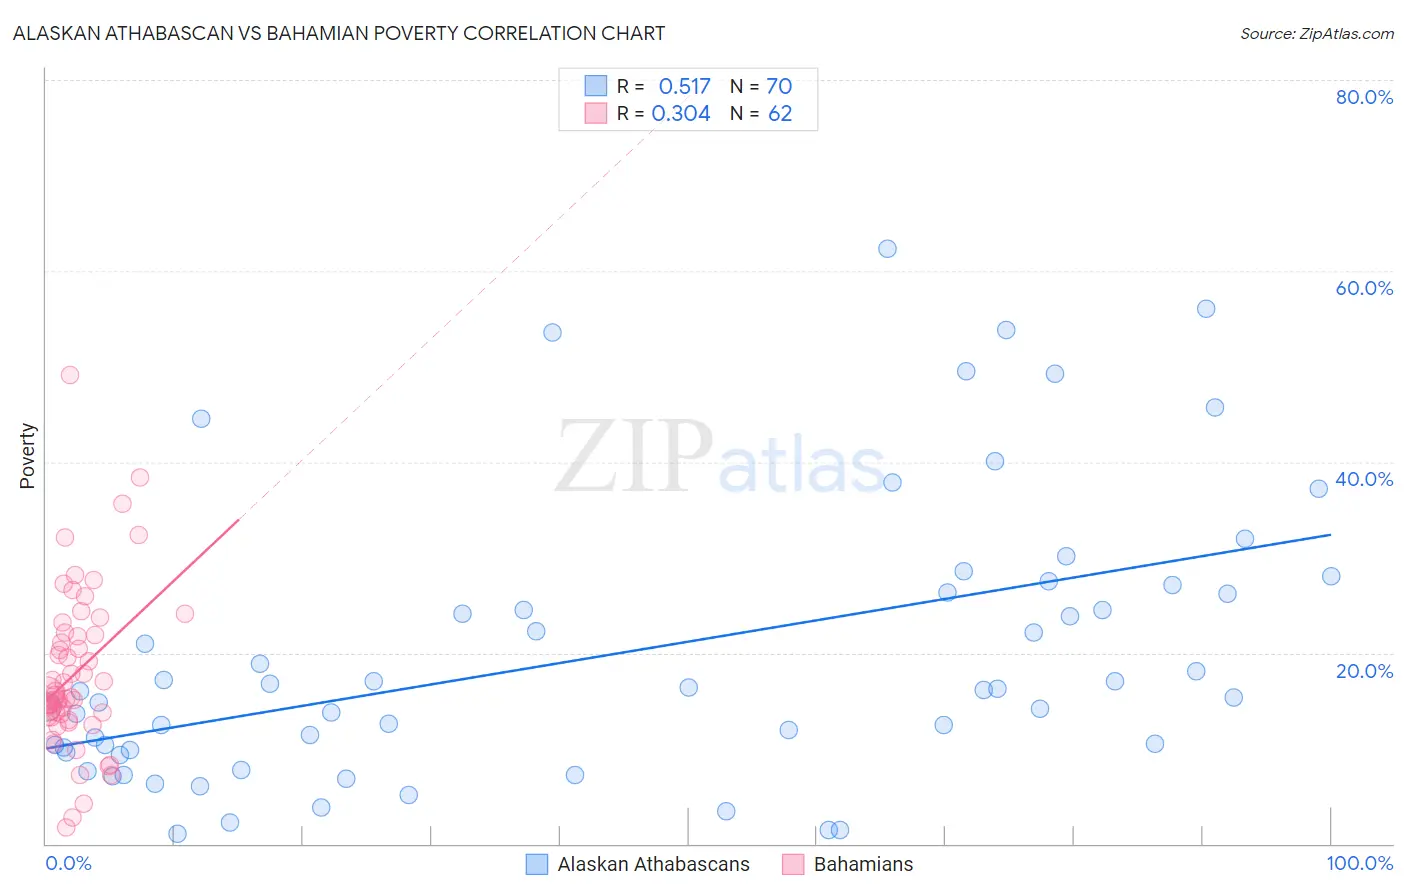
Alaskan Athabascan vs Bahamian Poverty Correlation Chart
The statistical analysis conducted on geographies consisting of 45,813,239 people shows a substantial positive correlation between the proportion of Alaskan Athabascans and poverty level in the United States with a correlation coefficient (R) of 0.517 and weighted average of 13.6%. Similarly, the statistical analysis conducted on geographies consisting of 112,639,225 people shows a mild positive correlation between the proportion of Bahamians and poverty level in the United States with a correlation coefficient (R) of 0.304 and weighted average of 15.4%, a difference of 13.4%.
Poverty Correlation Summary
| Measurement | Alaskan Athabascan | Bahamian |
| Minimum | 1.1% | 1.7% |
| Maximum | 62.3% | 49.1% |
| Range | 61.2% | 47.4% |
| Mean | 19.9% | 17.8% |
| Median | 16.0% | 15.4% |
| Interquartile 25% (IQ1) | 9.8% | 13.4% |
| Interquartile 75% (IQ3) | 26.3% | 21.8% |
| Interquartile Range (IQR) | 16.5% | 8.4% |
| Standard Deviation (Sample) | 14.7% | 8.5% |
| Standard Deviation (Population) | 14.6% | 8.4% |
Similar Demographics by Poverty
Demographics Similar to Alaskan Athabascans by Poverty
In terms of poverty, the demographic groups most similar to Alaskan Athabascans are Osage (13.6%, a difference of 0.060%), Nigerian (13.6%, a difference of 0.17%), Immigrants from Nigeria (13.5%, a difference of 0.30%), Alaska Native (13.5%, a difference of 0.75%), and Marshallese (13.4%, a difference of 0.90%).
| Demographics | Rating | Rank | Poverty |
| Immigrants | Africa | 2.5 /100 | #223 | Tragic 13.4% |
| Immigrants | Eritrea | 2.4 /100 | #224 | Tragic 13.4% |
| German Russians | 2.2 /100 | #225 | Tragic 13.4% |
| Marshallese | 2.2 /100 | #226 | Tragic 13.4% |
| Alaska Natives | 2.1 /100 | #227 | Tragic 13.5% |
| Immigrants | Nigeria | 1.7 /100 | #228 | Tragic 13.5% |
| Osage | 1.5 /100 | #229 | Tragic 13.6% |
| Alaskan Athabascans | 1.5 /100 | #230 | Tragic 13.6% |
| Nigerians | 1.4 /100 | #231 | Tragic 13.6% |
| Fijians | 0.8 /100 | #232 | Tragic 13.7% |
| Immigrants | Saudi Arabia | 0.8 /100 | #233 | Tragic 13.8% |
| Immigrants | Laos | 0.7 /100 | #234 | Tragic 13.8% |
| Cubans | 0.6 /100 | #235 | Tragic 13.9% |
| Immigrants | Armenia | 0.5 /100 | #236 | Tragic 13.9% |
| French American Indians | 0.5 /100 | #237 | Tragic 13.9% |
Demographics Similar to Bahamians by Poverty
In terms of poverty, the demographic groups most similar to Bahamians are Somali (15.4%, a difference of 0.13%), Immigrants from Central America (15.4%, a difference of 0.21%), Senegalese (15.3%, a difference of 0.59%), Immigrants from Caribbean (15.5%, a difference of 0.61%), and Immigrants from Senegal (15.3%, a difference of 0.68%).
| Demographics | Rating | Rank | Poverty |
| Blackfeet | 0.0 /100 | #294 | Tragic 15.2% |
| Guatemalans | 0.0 /100 | #295 | Tragic 15.3% |
| Hispanics or Latinos | 0.0 /100 | #296 | Tragic 15.3% |
| Immigrants | Bangladesh | 0.0 /100 | #297 | Tragic 15.3% |
| Immigrants | Senegal | 0.0 /100 | #298 | Tragic 15.3% |
| Senegalese | 0.0 /100 | #299 | Tragic 15.3% |
| Immigrants | Central America | 0.0 /100 | #300 | Tragic 15.4% |
| Bahamians | 0.0 /100 | #301 | Tragic 15.4% |
| Somalis | 0.0 /100 | #302 | Tragic 15.4% |
| Immigrants | Caribbean | 0.0 /100 | #303 | Tragic 15.5% |
| Immigrants | Mexico | 0.0 /100 | #304 | Tragic 15.5% |
| Immigrants | Guatemala | 0.0 /100 | #305 | Tragic 15.5% |
| Creek | 0.0 /100 | #306 | Tragic 15.6% |
| Africans | 0.0 /100 | #307 | Tragic 15.6% |
| Choctaw | 0.0 /100 | #308 | Tragic 15.6% |