Alaskan Athabascan vs Immigrants from Dominican Republic Female Poverty Among 25-34 Year Olds
COMPARE
Alaskan Athabascan
Immigrants from Dominican Republic
Female Poverty Among 25-34 Year Olds
Female Poverty Among 25-34 Year Olds Comparison
Alaskan Athabascans
Immigrants from Dominican Republic
19.1%
FEMALE POVERTY AMONG 25-34 YEAR OLDS
0.0/ 100
METRIC RATING
328th/ 347
METRIC RANK
17.6%
FEMALE POVERTY AMONG 25-34 YEAR OLDS
0.0/ 100
METRIC RATING
314th/ 347
METRIC RANK
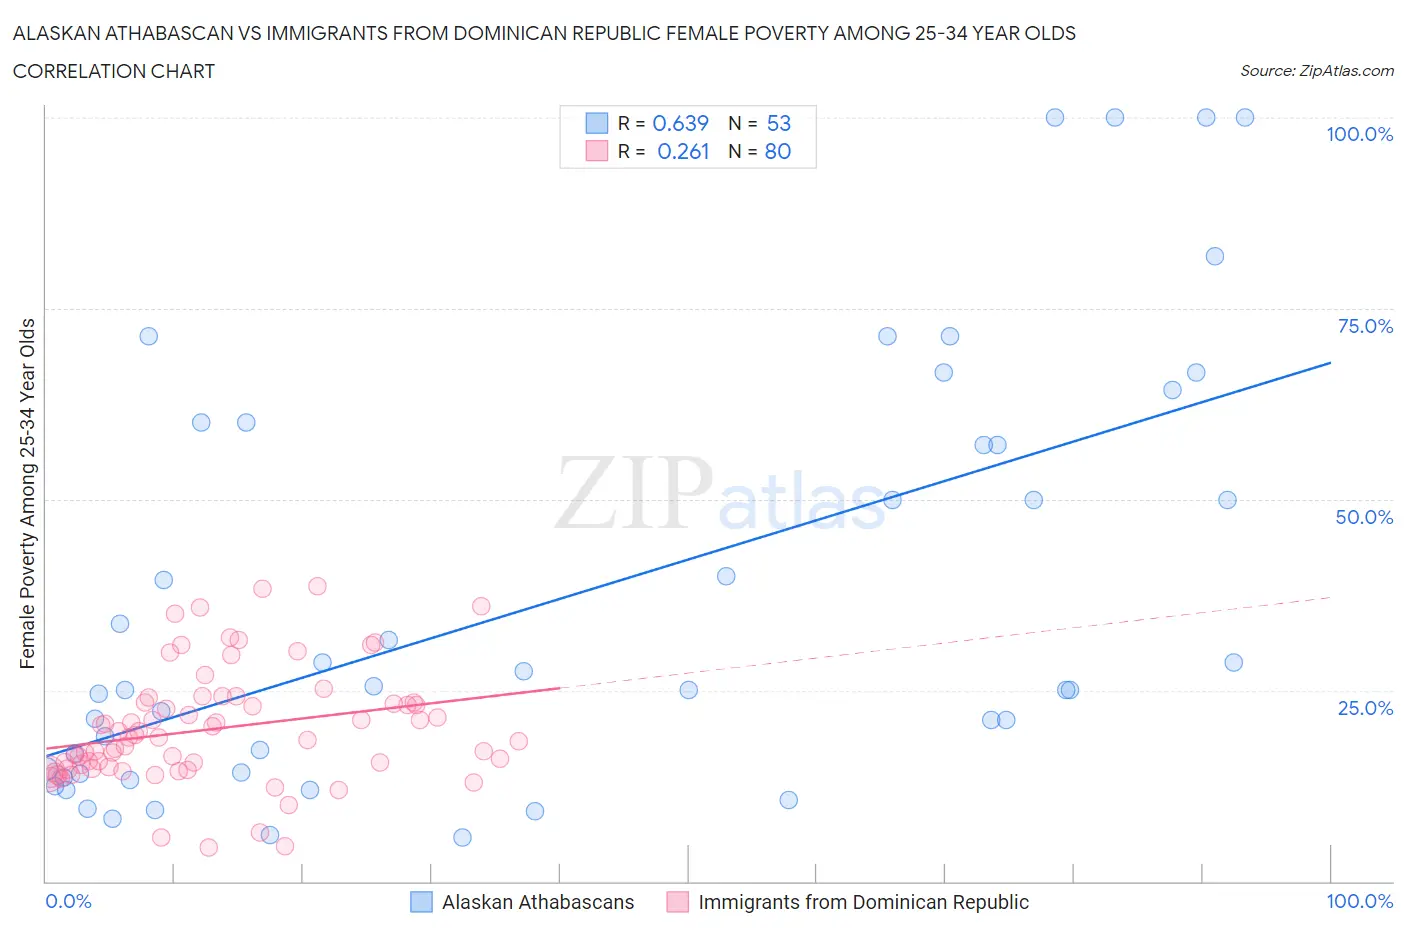
Alaskan Athabascan vs Immigrants from Dominican Republic Female Poverty Among 25-34 Year Olds Correlation Chart
The statistical analysis conducted on geographies consisting of 45,660,440 people shows a significant positive correlation between the proportion of Alaskan Athabascans and poverty level among females between the ages 25 and 34 in the United States with a correlation coefficient (R) of 0.639 and weighted average of 19.1%. Similarly, the statistical analysis conducted on geographies consisting of 271,687,729 people shows a weak positive correlation between the proportion of Immigrants from Dominican Republic and poverty level among females between the ages 25 and 34 in the United States with a correlation coefficient (R) of 0.261 and weighted average of 17.6%, a difference of 8.6%.
Female Poverty Among 25-34 Year Olds Correlation Summary
| Measurement | Alaskan Athabascan | Immigrants from Dominican Republic |
| Minimum | 5.7% | 4.4% |
| Maximum | 100.0% | 38.7% |
| Range | 94.3% | 34.3% |
| Mean | 37.0% | 20.0% |
| Median | 25.0% | 18.8% |
| Interquartile 25% (IQ1) | 14.2% | 14.8% |
| Interquartile 75% (IQ3) | 58.6% | 23.4% |
| Interquartile Range (IQR) | 44.4% | 8.5% |
| Standard Deviation (Sample) | 27.7% | 7.5% |
| Standard Deviation (Population) | 27.4% | 7.4% |
Demographics Similar to Alaskan Athabascans and Immigrants from Dominican Republic by Female Poverty Among 25-34 Year Olds
In terms of female poverty among 25-34 year olds, the demographic groups most similar to Alaskan Athabascans are Cheyenne (19.1%, a difference of 0.080%), Creek (19.2%, a difference of 0.25%), Black/African American (18.9%, a difference of 1.0%), Paiute (19.6%, a difference of 2.5%), and Kiowa (19.7%, a difference of 2.9%). Similarly, the demographic groups most similar to Immigrants from Dominican Republic are Yakama (17.6%, a difference of 0.22%), Dominican (17.6%, a difference of 0.22%), Colville (17.5%, a difference of 0.68%), Iroquois (17.5%, a difference of 0.76%), and Arapaho (17.8%, a difference of 1.0%).
| Demographics | Rating | Rank | Female Poverty Among 25-34 Year Olds |
| Immigrants | Honduras | 0.0 /100 | #311 | Tragic 17.3% |
| Iroquois | 0.0 /100 | #312 | Tragic 17.5% |
| Colville | 0.0 /100 | #313 | Tragic 17.5% |
| Immigrants | Dominican Republic | 0.0 /100 | #314 | Tragic 17.6% |
| Yakama | 0.0 /100 | #315 | Tragic 17.6% |
| Dominicans | 0.0 /100 | #316 | Tragic 17.6% |
| Arapaho | 0.0 /100 | #317 | Tragic 17.8% |
| Ute | 0.0 /100 | #318 | Tragic 17.9% |
| Menominee | 0.0 /100 | #319 | Tragic 18.0% |
| Chippewa | 0.0 /100 | #320 | Tragic 18.0% |
| Choctaw | 0.0 /100 | #321 | Tragic 18.1% |
| Central American Indians | 0.0 /100 | #322 | Tragic 18.2% |
| Seminole | 0.0 /100 | #323 | Tragic 18.3% |
| Dutch West Indians | 0.0 /100 | #324 | Tragic 18.4% |
| Inupiat | 0.0 /100 | #325 | Tragic 18.5% |
| Blacks/African Americans | 0.0 /100 | #326 | Tragic 18.9% |
| Cheyenne | 0.0 /100 | #327 | Tragic 19.1% |
| Alaskan Athabascans | 0.0 /100 | #328 | Tragic 19.1% |
| Creek | 0.0 /100 | #329 | Tragic 19.2% |
| Paiute | 0.0 /100 | #330 | Tragic 19.6% |
| Kiowa | 0.0 /100 | #331 | Tragic 19.7% |