Lithuanian vs Immigrants from Dominican Republic Female Poverty Among 25-34 Year Olds
COMPARE
Lithuanian
Immigrants from Dominican Republic
Female Poverty Among 25-34 Year Olds
Female Poverty Among 25-34 Year Olds Comparison
Lithuanians
Immigrants from Dominican Republic
12.2%
FEMALE POVERTY AMONG 25-34 YEAR OLDS
99.1/ 100
METRIC RATING
72nd/ 347
METRIC RANK
17.6%
FEMALE POVERTY AMONG 25-34 YEAR OLDS
0.0/ 100
METRIC RATING
314th/ 347
METRIC RANK
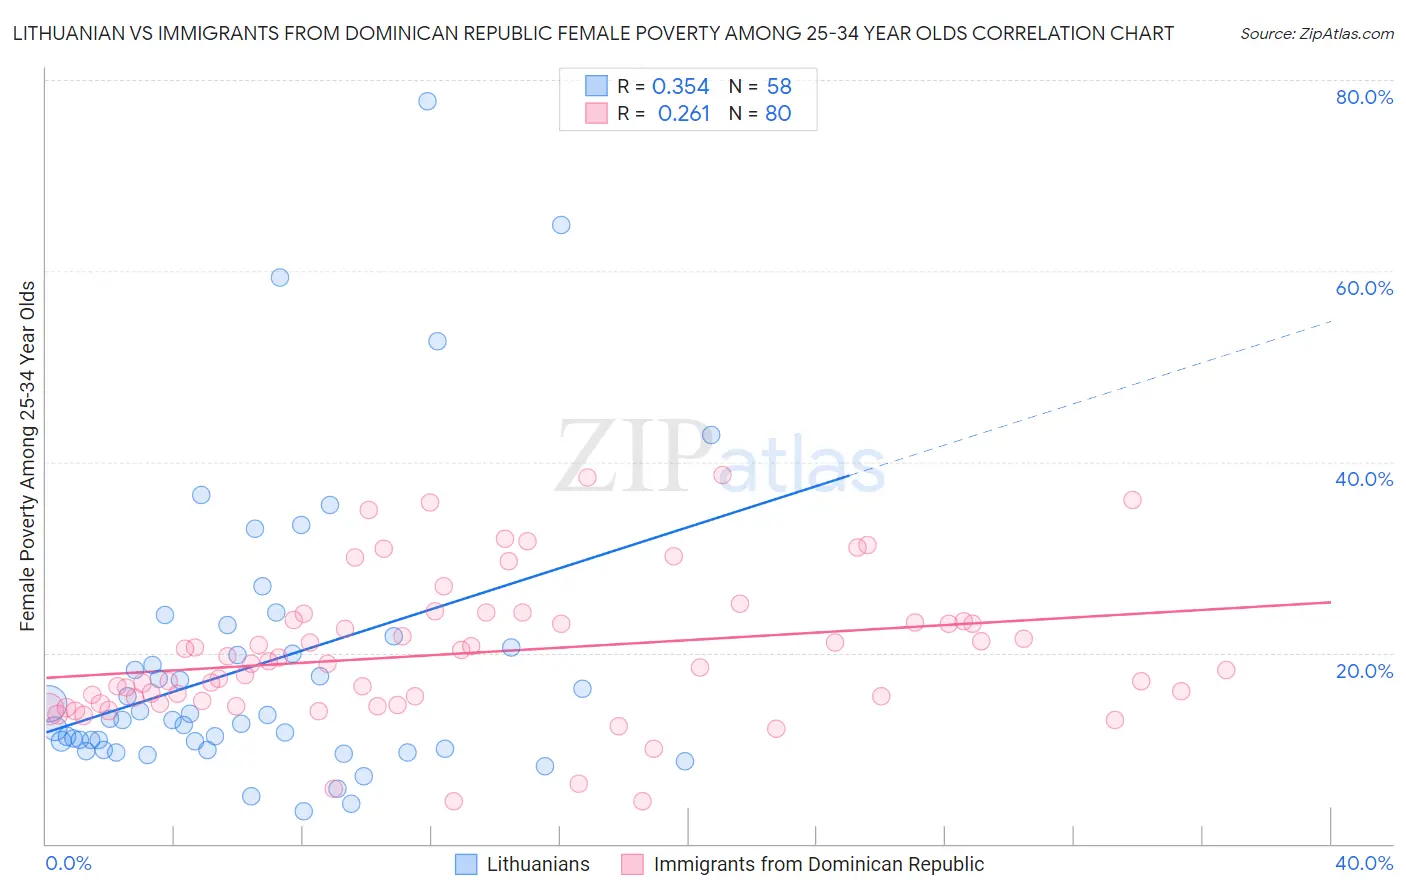
Lithuanian vs Immigrants from Dominican Republic Female Poverty Among 25-34 Year Olds Correlation Chart
The statistical analysis conducted on geographies consisting of 411,639,543 people shows a mild positive correlation between the proportion of Lithuanians and poverty level among females between the ages 25 and 34 in the United States with a correlation coefficient (R) of 0.354 and weighted average of 12.2%. Similarly, the statistical analysis conducted on geographies consisting of 271,687,729 people shows a weak positive correlation between the proportion of Immigrants from Dominican Republic and poverty level among females between the ages 25 and 34 in the United States with a correlation coefficient (R) of 0.261 and weighted average of 17.6%, a difference of 43.9%.
Female Poverty Among 25-34 Year Olds Correlation Summary
| Measurement | Lithuanian | Immigrants from Dominican Republic |
| Minimum | 3.4% | 4.4% |
| Maximum | 77.8% | 38.7% |
| Range | 74.3% | 34.3% |
| Mean | 18.7% | 20.0% |
| Median | 13.0% | 18.8% |
| Interquartile 25% (IQ1) | 9.9% | 14.8% |
| Interquartile 75% (IQ3) | 20.6% | 23.4% |
| Interquartile Range (IQR) | 10.7% | 8.5% |
| Standard Deviation (Sample) | 15.0% | 7.5% |
| Standard Deviation (Population) | 14.9% | 7.4% |
Similar Demographics by Female Poverty Among 25-34 Year Olds
Demographics Similar to Lithuanians by Female Poverty Among 25-34 Year Olds
In terms of female poverty among 25-34 year olds, the demographic groups most similar to Lithuanians are Immigrants from Scotland (12.2%, a difference of 0.050%), Immigrants from Belgium (12.2%, a difference of 0.060%), Immigrants from Lebanon (12.2%, a difference of 0.090%), Sri Lankan (12.2%, a difference of 0.12%), and Immigrants from Vietnam (12.3%, a difference of 0.31%).
| Demographics | Rating | Rank | Female Poverty Among 25-34 Year Olds |
| Armenians | 99.2 /100 | #65 | Exceptional 12.2% |
| Immigrants | Europe | 99.2 /100 | #66 | Exceptional 12.2% |
| Laotians | 99.2 /100 | #67 | Exceptional 12.2% |
| Sri Lankans | 99.1 /100 | #68 | Exceptional 12.2% |
| Immigrants | Lebanon | 99.1 /100 | #69 | Exceptional 12.2% |
| Immigrants | Belgium | 99.1 /100 | #70 | Exceptional 12.2% |
| Immigrants | Scotland | 99.1 /100 | #71 | Exceptional 12.2% |
| Lithuanians | 99.1 /100 | #72 | Exceptional 12.2% |
| Immigrants | Vietnam | 98.9 /100 | #73 | Exceptional 12.3% |
| Immigrants | Sweden | 98.9 /100 | #74 | Exceptional 12.3% |
| Estonians | 98.9 /100 | #75 | Exceptional 12.3% |
| Greeks | 98.9 /100 | #76 | Exceptional 12.3% |
| Immigrants | Italy | 98.8 /100 | #77 | Exceptional 12.3% |
| Immigrants | Ukraine | 98.6 /100 | #78 | Exceptional 12.3% |
| Immigrants | Jordan | 98.5 /100 | #79 | Exceptional 12.4% |
Demographics Similar to Immigrants from Dominican Republic by Female Poverty Among 25-34 Year Olds
In terms of female poverty among 25-34 year olds, the demographic groups most similar to Immigrants from Dominican Republic are Yakama (17.6%, a difference of 0.22%), Dominican (17.6%, a difference of 0.22%), Colville (17.5%, a difference of 0.68%), Iroquois (17.5%, a difference of 0.76%), and Arapaho (17.8%, a difference of 1.0%).
| Demographics | Rating | Rank | Female Poverty Among 25-34 Year Olds |
| Yaqui | 0.0 /100 | #307 | Tragic 17.0% |
| Africans | 0.0 /100 | #308 | Tragic 17.0% |
| Ottawa | 0.0 /100 | #309 | Tragic 17.1% |
| Cherokee | 0.0 /100 | #310 | Tragic 17.2% |
| Immigrants | Honduras | 0.0 /100 | #311 | Tragic 17.3% |
| Iroquois | 0.0 /100 | #312 | Tragic 17.5% |
| Colville | 0.0 /100 | #313 | Tragic 17.5% |
| Immigrants | Dominican Republic | 0.0 /100 | #314 | Tragic 17.6% |
| Yakama | 0.0 /100 | #315 | Tragic 17.6% |
| Dominicans | 0.0 /100 | #316 | Tragic 17.6% |
| Arapaho | 0.0 /100 | #317 | Tragic 17.8% |
| Ute | 0.0 /100 | #318 | Tragic 17.9% |
| Menominee | 0.0 /100 | #319 | Tragic 18.0% |
| Chippewa | 0.0 /100 | #320 | Tragic 18.0% |
| Choctaw | 0.0 /100 | #321 | Tragic 18.1% |