Immigrants from Sierra Leone vs Immigrants from Dominican Republic Female Poverty Among 25-34 Year Olds
COMPARE
Immigrants from Sierra Leone
Immigrants from Dominican Republic
Female Poverty Among 25-34 Year Olds
Female Poverty Among 25-34 Year Olds Comparison
Immigrants from Sierra Leone
Immigrants from Dominican Republic
13.3%
FEMALE POVERTY AMONG 25-34 YEAR OLDS
72.9/ 100
METRIC RATING
155th/ 347
METRIC RANK
17.6%
FEMALE POVERTY AMONG 25-34 YEAR OLDS
0.0/ 100
METRIC RATING
314th/ 347
METRIC RANK
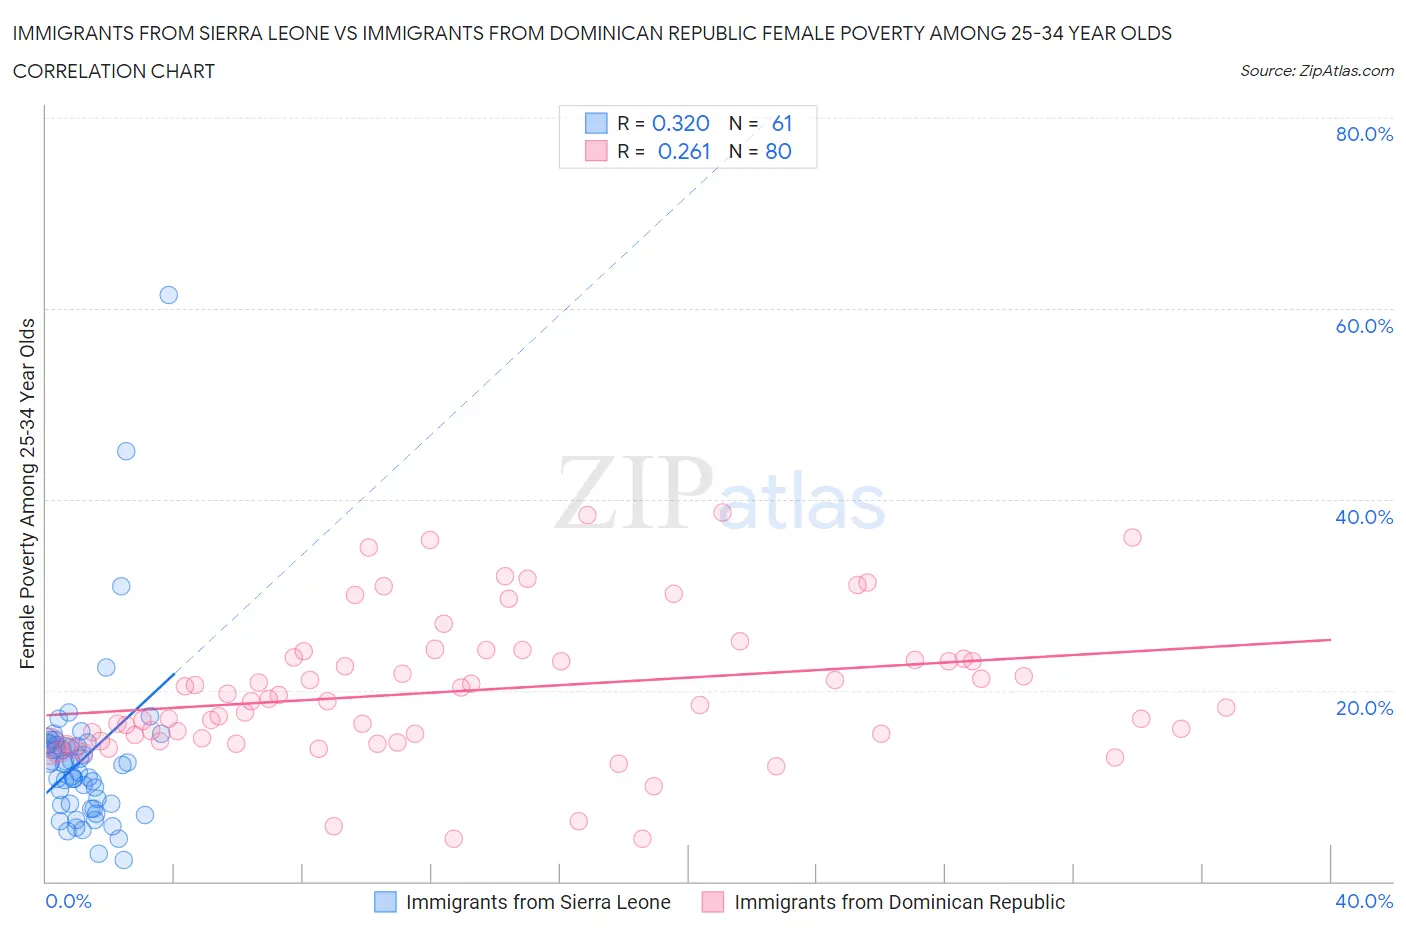
Immigrants from Sierra Leone vs Immigrants from Dominican Republic Female Poverty Among 25-34 Year Olds Correlation Chart
The statistical analysis conducted on geographies consisting of 101,180,694 people shows a mild positive correlation between the proportion of Immigrants from Sierra Leone and poverty level among females between the ages 25 and 34 in the United States with a correlation coefficient (R) of 0.320 and weighted average of 13.3%. Similarly, the statistical analysis conducted on geographies consisting of 271,687,729 people shows a weak positive correlation between the proportion of Immigrants from Dominican Republic and poverty level among females between the ages 25 and 34 in the United States with a correlation coefficient (R) of 0.261 and weighted average of 17.6%, a difference of 32.7%.
Female Poverty Among 25-34 Year Olds Correlation Summary
| Measurement | Immigrants from Sierra Leone | Immigrants from Dominican Republic |
| Minimum | 2.2% | 4.4% |
| Maximum | 61.4% | 38.7% |
| Range | 59.2% | 34.3% |
| Mean | 12.9% | 20.0% |
| Median | 12.4% | 18.8% |
| Interquartile 25% (IQ1) | 8.1% | 14.8% |
| Interquartile 75% (IQ3) | 14.4% | 23.4% |
| Interquartile Range (IQR) | 6.4% | 8.5% |
| Standard Deviation (Sample) | 9.0% | 7.5% |
| Standard Deviation (Population) | 8.9% | 7.4% |
Similar Demographics by Female Poverty Among 25-34 Year Olds
Demographics Similar to Immigrants from Sierra Leone by Female Poverty Among 25-34 Year Olds
In terms of female poverty among 25-34 year olds, the demographic groups most similar to Immigrants from Sierra Leone are Arab (13.2%, a difference of 0.070%), Northern European (13.2%, a difference of 0.090%), Immigrants from Cameroon (13.3%, a difference of 0.090%), Immigrants from Western Europe (13.3%, a difference of 0.27%), and Slavic (13.2%, a difference of 0.32%).
| Demographics | Rating | Rank | Female Poverty Among 25-34 Year Olds |
| Lebanese | 76.8 /100 | #148 | Good 13.2% |
| Sierra Leoneans | 76.3 /100 | #149 | Good 13.2% |
| Iraqis | 76.0 /100 | #150 | Good 13.2% |
| Costa Ricans | 75.8 /100 | #151 | Good 13.2% |
| Slavs | 75.7 /100 | #152 | Good 13.2% |
| Northern Europeans | 73.7 /100 | #153 | Good 13.2% |
| Arabs | 73.5 /100 | #154 | Good 13.2% |
| Immigrants | Sierra Leone | 72.9 /100 | #155 | Good 13.3% |
| Immigrants | Cameroon | 72.0 /100 | #156 | Good 13.3% |
| Immigrants | Western Europe | 70.3 /100 | #157 | Good 13.3% |
| Immigrants | Colombia | 69.2 /100 | #158 | Good 13.3% |
| Uruguayans | 66.9 /100 | #159 | Good 13.3% |
| Immigrants | South America | 66.3 /100 | #160 | Good 13.3% |
| Icelanders | 65.7 /100 | #161 | Good 13.3% |
| Ugandans | 64.1 /100 | #162 | Good 13.4% |
Demographics Similar to Immigrants from Dominican Republic by Female Poverty Among 25-34 Year Olds
In terms of female poverty among 25-34 year olds, the demographic groups most similar to Immigrants from Dominican Republic are Yakama (17.6%, a difference of 0.22%), Dominican (17.6%, a difference of 0.22%), Colville (17.5%, a difference of 0.68%), Iroquois (17.5%, a difference of 0.76%), and Arapaho (17.8%, a difference of 1.0%).
| Demographics | Rating | Rank | Female Poverty Among 25-34 Year Olds |
| Yaqui | 0.0 /100 | #307 | Tragic 17.0% |
| Africans | 0.0 /100 | #308 | Tragic 17.0% |
| Ottawa | 0.0 /100 | #309 | Tragic 17.1% |
| Cherokee | 0.0 /100 | #310 | Tragic 17.2% |
| Immigrants | Honduras | 0.0 /100 | #311 | Tragic 17.3% |
| Iroquois | 0.0 /100 | #312 | Tragic 17.5% |
| Colville | 0.0 /100 | #313 | Tragic 17.5% |
| Immigrants | Dominican Republic | 0.0 /100 | #314 | Tragic 17.6% |
| Yakama | 0.0 /100 | #315 | Tragic 17.6% |
| Dominicans | 0.0 /100 | #316 | Tragic 17.6% |
| Arapaho | 0.0 /100 | #317 | Tragic 17.8% |
| Ute | 0.0 /100 | #318 | Tragic 17.9% |
| Menominee | 0.0 /100 | #319 | Tragic 18.0% |
| Chippewa | 0.0 /100 | #320 | Tragic 18.0% |
| Choctaw | 0.0 /100 | #321 | Tragic 18.1% |