Alaskan Athabascan vs Immigrants from Dominican Republic Unemployment Among Ages 45 to 54 years
COMPARE
Alaskan Athabascan
Immigrants from Dominican Republic
Unemployment Among Ages 45 to 54 years
Unemployment Among Ages 45 to 54 years Comparison
Alaskan Athabascans
Immigrants from Dominican Republic
8.5%
UNEMPLOYMENT AMONG AGES 45 TO 54 YEARS
0.0/ 100
METRIC RATING
342nd/ 347
METRIC RANK
6.3%
UNEMPLOYMENT AMONG AGES 45 TO 54 YEARS
0.0/ 100
METRIC RATING
330th/ 347
METRIC RANK
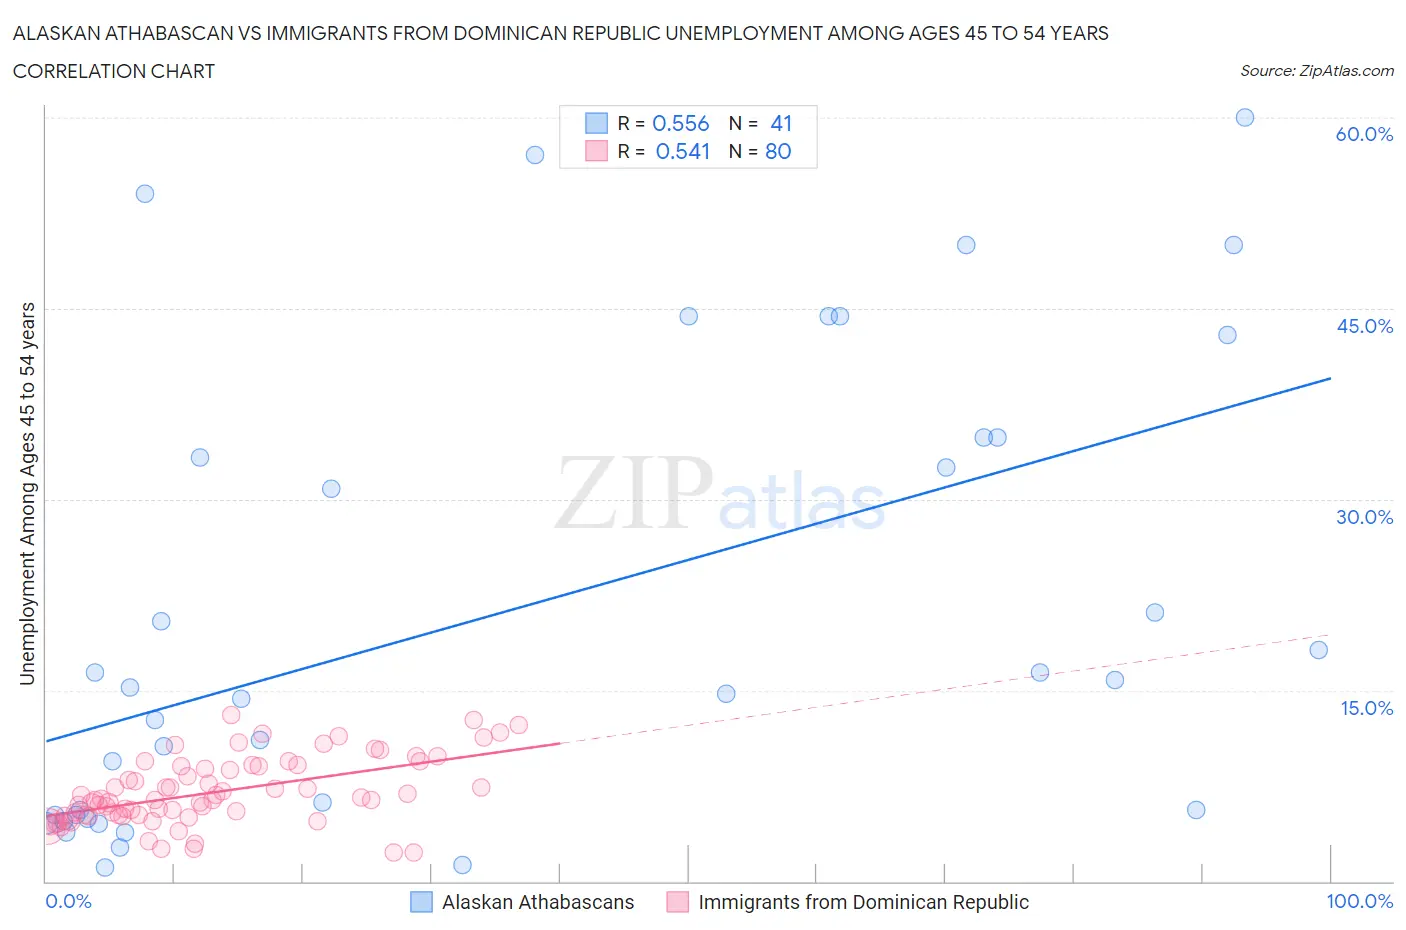
Alaskan Athabascan vs Immigrants from Dominican Republic Unemployment Among Ages 45 to 54 years Correlation Chart
The statistical analysis conducted on geographies consisting of 45,433,240 people shows a substantial positive correlation between the proportion of Alaskan Athabascans and unemployment rate among population between the ages 45 and 54 in the United States with a correlation coefficient (R) of 0.556 and weighted average of 8.5%. Similarly, the statistical analysis conducted on geographies consisting of 270,132,931 people shows a substantial positive correlation between the proportion of Immigrants from Dominican Republic and unemployment rate among population between the ages 45 and 54 in the United States with a correlation coefficient (R) of 0.541 and weighted average of 6.3%, a difference of 35.1%.
Unemployment Among Ages 45 to 54 years Correlation Summary
| Measurement | Alaskan Athabascan | Immigrants from Dominican Republic |
| Minimum | 1.1% | 2.3% |
| Maximum | 60.0% | 13.1% |
| Range | 58.9% | 10.8% |
| Mean | 21.2% | 7.0% |
| Median | 15.2% | 6.4% |
| Interquartile 25% (IQ1) | 5.2% | 5.2% |
| Interquartile 75% (IQ3) | 34.9% | 9.0% |
| Interquartile Range (IQR) | 29.7% | 3.9% |
| Standard Deviation (Sample) | 18.1% | 2.6% |
| Standard Deviation (Population) | 17.8% | 2.6% |
Demographics Similar to Alaskan Athabascans and Immigrants from Dominican Republic by Unemployment Among Ages 45 to 54 years
In terms of unemployment among ages 45 to 54 years, the demographic groups most similar to Alaskan Athabascans are Inupiat (9.2%, a difference of 8.6%), Paiute (7.8%, a difference of 8.8%), Yuman (9.5%, a difference of 12.2%), Hopi (7.5%, a difference of 12.6%), and Arapaho (7.5%, a difference of 13.1%). Similarly, the demographic groups most similar to Immigrants from Dominican Republic are Tohono O'odham (6.3%, a difference of 0.050%), Alaska Native (6.3%, a difference of 0.13%), Pueblo (6.2%, a difference of 0.83%), Dominican (6.2%, a difference of 1.0%), and Ute (6.2%, a difference of 1.3%).
| Demographics | Rating | Rank | Unemployment Among Ages 45 to 54 years |
| Ute | 0.0 /100 | #326 | Tragic 6.2% |
| Dominicans | 0.0 /100 | #327 | Tragic 6.2% |
| Pueblo | 0.0 /100 | #328 | Tragic 6.2% |
| Alaska Natives | 0.0 /100 | #329 | Tragic 6.3% |
| Immigrants | Dominican Republic | 0.0 /100 | #330 | Tragic 6.3% |
| Tohono O'odham | 0.0 /100 | #331 | Tragic 6.3% |
| Pima | 0.0 /100 | #332 | Tragic 6.4% |
| Immigrants | Yemen | 0.0 /100 | #333 | Tragic 6.5% |
| Sioux | 0.0 /100 | #334 | Tragic 6.6% |
| Navajo | 0.0 /100 | #335 | Tragic 6.7% |
| Puerto Ricans | 0.0 /100 | #336 | Tragic 6.8% |
| Apache | 0.0 /100 | #337 | Tragic 7.0% |
| Colville | 0.0 /100 | #338 | Tragic 7.4% |
| Arapaho | 0.0 /100 | #339 | Tragic 7.5% |
| Hopi | 0.0 /100 | #340 | Tragic 7.5% |
| Paiute | 0.0 /100 | #341 | Tragic 7.8% |
| Alaskan Athabascans | 0.0 /100 | #342 | Tragic 8.5% |
| Inupiat | 0.0 /100 | #343 | Tragic 9.2% |
| Yuman | 0.0 /100 | #344 | Tragic 9.5% |
| Cheyenne | 0.0 /100 | #345 | Tragic 10.6% |
| Yup'ik | 0.0 /100 | #346 | Tragic 11.9% |