Alaskan Athabascan vs Immigrants from Dominican Republic 9th Grade
COMPARE
Alaskan Athabascan
Immigrants from Dominican Republic
9th Grade
9th Grade Comparison
Alaskan Athabascans
Immigrants from Dominican Republic
96.4%
9TH GRADE
100.0/ 100
METRIC RATING
21st/ 347
METRIC RANK
90.5%
9TH GRADE
0.0/ 100
METRIC RATING
336th/ 347
METRIC RANK
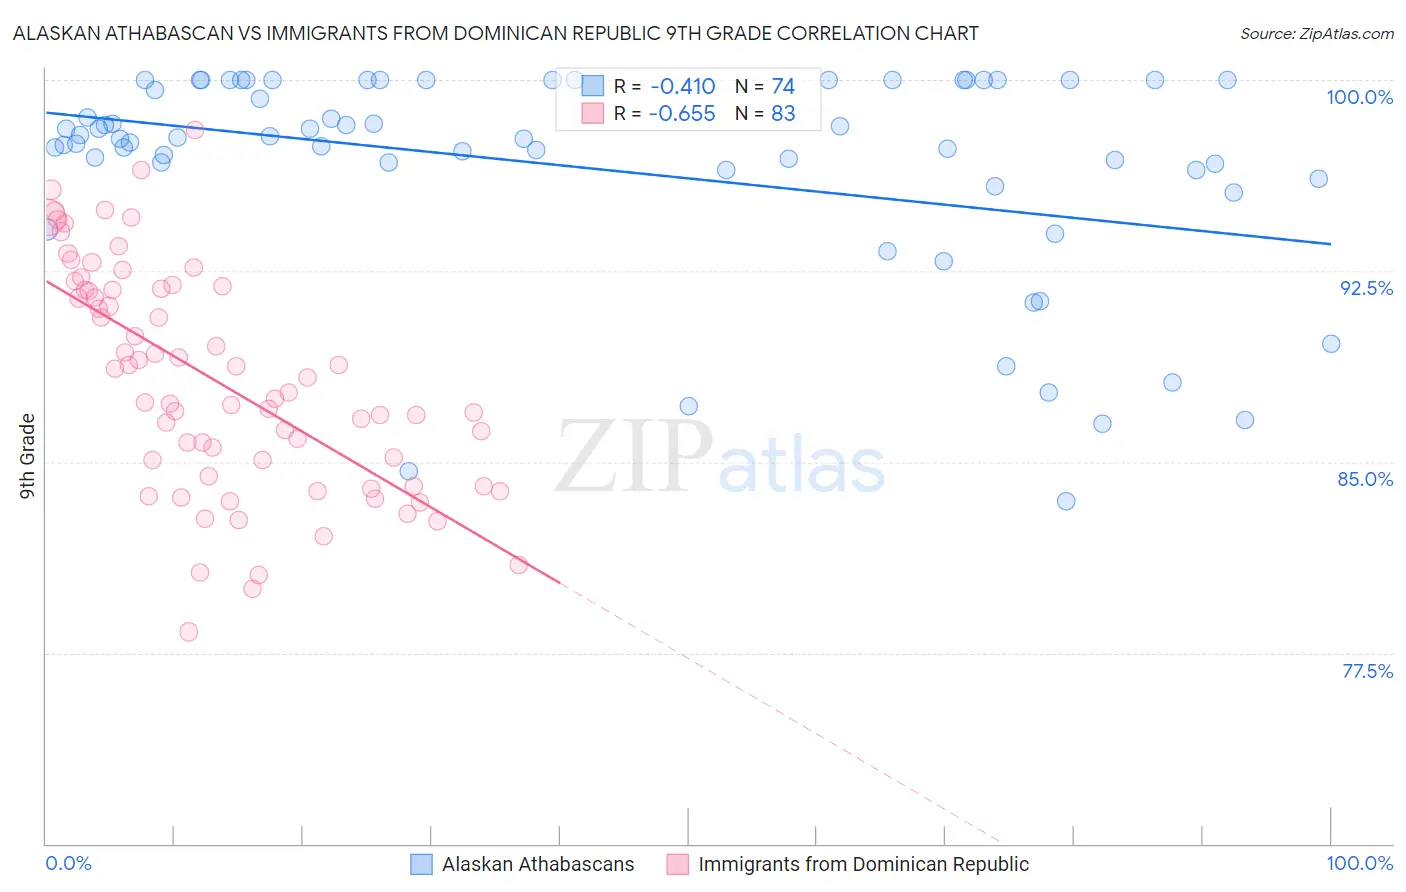
Alaskan Athabascan vs Immigrants from Dominican Republic 9th Grade Correlation Chart
The statistical analysis conducted on geographies consisting of 45,820,365 people shows a moderate negative correlation between the proportion of Alaskan Athabascans and percentage of population with at least 9th grade education in the United States with a correlation coefficient (R) of -0.410 and weighted average of 96.4%. Similarly, the statistical analysis conducted on geographies consisting of 275,144,349 people shows a significant negative correlation between the proportion of Immigrants from Dominican Republic and percentage of population with at least 9th grade education in the United States with a correlation coefficient (R) of -0.655 and weighted average of 90.5%, a difference of 6.6%.
9th Grade Correlation Summary
| Measurement | Alaskan Athabascan | Immigrants from Dominican Republic |
| Minimum | 83.5% | 78.3% |
| Maximum | 100.0% | 98.1% |
| Range | 16.5% | 19.7% |
| Mean | 96.5% | 88.2% |
| Median | 97.7% | 87.7% |
| Interquartile 25% (IQ1) | 96.4% | 84.5% |
| Interquartile 75% (IQ3) | 100.0% | 91.8% |
| Interquartile Range (IQR) | 3.6% | 7.3% |
| Standard Deviation (Sample) | 4.2% | 4.4% |
| Standard Deviation (Population) | 4.1% | 4.4% |
Similar Demographics by 9th Grade
Demographics Similar to Alaskan Athabascans by 9th Grade
In terms of 9th grade, the demographic groups most similar to Alaskan Athabascans are Italian (96.4%, a difference of 0.010%), European (96.4%, a difference of 0.010%), Welsh (96.4%, a difference of 0.020%), Czech (96.4%, a difference of 0.020%), and Scandinavian (96.5%, a difference of 0.050%).
| Demographics | Rating | Rank | 9th Grade |
| Scottish | 100.0 /100 | #14 | Exceptional 96.5% |
| Irish | 100.0 /100 | #15 | Exceptional 96.5% |
| Croatians | 100.0 /100 | #16 | Exceptional 96.5% |
| Dutch | 100.0 /100 | #17 | Exceptional 96.5% |
| Scandinavians | 100.0 /100 | #18 | Exceptional 96.5% |
| Welsh | 100.0 /100 | #19 | Exceptional 96.4% |
| Italians | 100.0 /100 | #20 | Exceptional 96.4% |
| Alaskan Athabascans | 100.0 /100 | #21 | Exceptional 96.4% |
| Europeans | 100.0 /100 | #22 | Exceptional 96.4% |
| Czechs | 100.0 /100 | #23 | Exceptional 96.4% |
| Latvians | 100.0 /100 | #24 | Exceptional 96.4% |
| French | 100.0 /100 | #25 | Exceptional 96.3% |
| French Canadians | 100.0 /100 | #26 | Exceptional 96.3% |
| Scotch-Irish | 100.0 /100 | #27 | Exceptional 96.3% |
| Eastern Europeans | 100.0 /100 | #28 | Exceptional 96.3% |
Demographics Similar to Immigrants from Dominican Republic by 9th Grade
In terms of 9th grade, the demographic groups most similar to Immigrants from Dominican Republic are Immigrants from Latin America (90.4%, a difference of 0.12%), Central American (90.4%, a difference of 0.13%), Immigrants from Honduras (90.6%, a difference of 0.14%), Immigrants from the Azores (90.8%, a difference of 0.31%), and Immigrants from Yemen (90.8%, a difference of 0.36%).
| Demographics | Rating | Rank | 9th Grade |
| Hondurans | 0.0 /100 | #329 | Tragic 91.0% |
| Immigrants | Cabo Verde | 0.0 /100 | #330 | Tragic 90.9% |
| Mexican American Indians | 0.0 /100 | #331 | Tragic 90.9% |
| Hispanics or Latinos | 0.0 /100 | #332 | Tragic 90.9% |
| Immigrants | Yemen | 0.0 /100 | #333 | Tragic 90.8% |
| Immigrants | Azores | 0.0 /100 | #334 | Tragic 90.8% |
| Immigrants | Honduras | 0.0 /100 | #335 | Tragic 90.6% |
| Immigrants | Dominican Republic | 0.0 /100 | #336 | Tragic 90.5% |
| Immigrants | Latin America | 0.0 /100 | #337 | Tragic 90.4% |
| Central Americans | 0.0 /100 | #338 | Tragic 90.4% |
| Yakama | 0.0 /100 | #339 | Tragic 90.1% |
| Mexicans | 0.0 /100 | #340 | Tragic 90.0% |
| Guatemalans | 0.0 /100 | #341 | Tragic 89.9% |
| Salvadorans | 0.0 /100 | #342 | Tragic 89.6% |
| Immigrants | Guatemala | 0.0 /100 | #343 | Tragic 89.4% |