Immigrants from Armenia vs Immigrants from Dominican Republic Female Poverty Among 25-34 Year Olds
COMPARE
Immigrants from Armenia
Immigrants from Dominican Republic
Female Poverty Among 25-34 Year Olds
Female Poverty Among 25-34 Year Olds Comparison
Immigrants from Armenia
Immigrants from Dominican Republic
12.6%
FEMALE POVERTY AMONG 25-34 YEAR OLDS
96.9/ 100
METRIC RATING
92nd/ 347
METRIC RANK
17.6%
FEMALE POVERTY AMONG 25-34 YEAR OLDS
0.0/ 100
METRIC RATING
314th/ 347
METRIC RANK
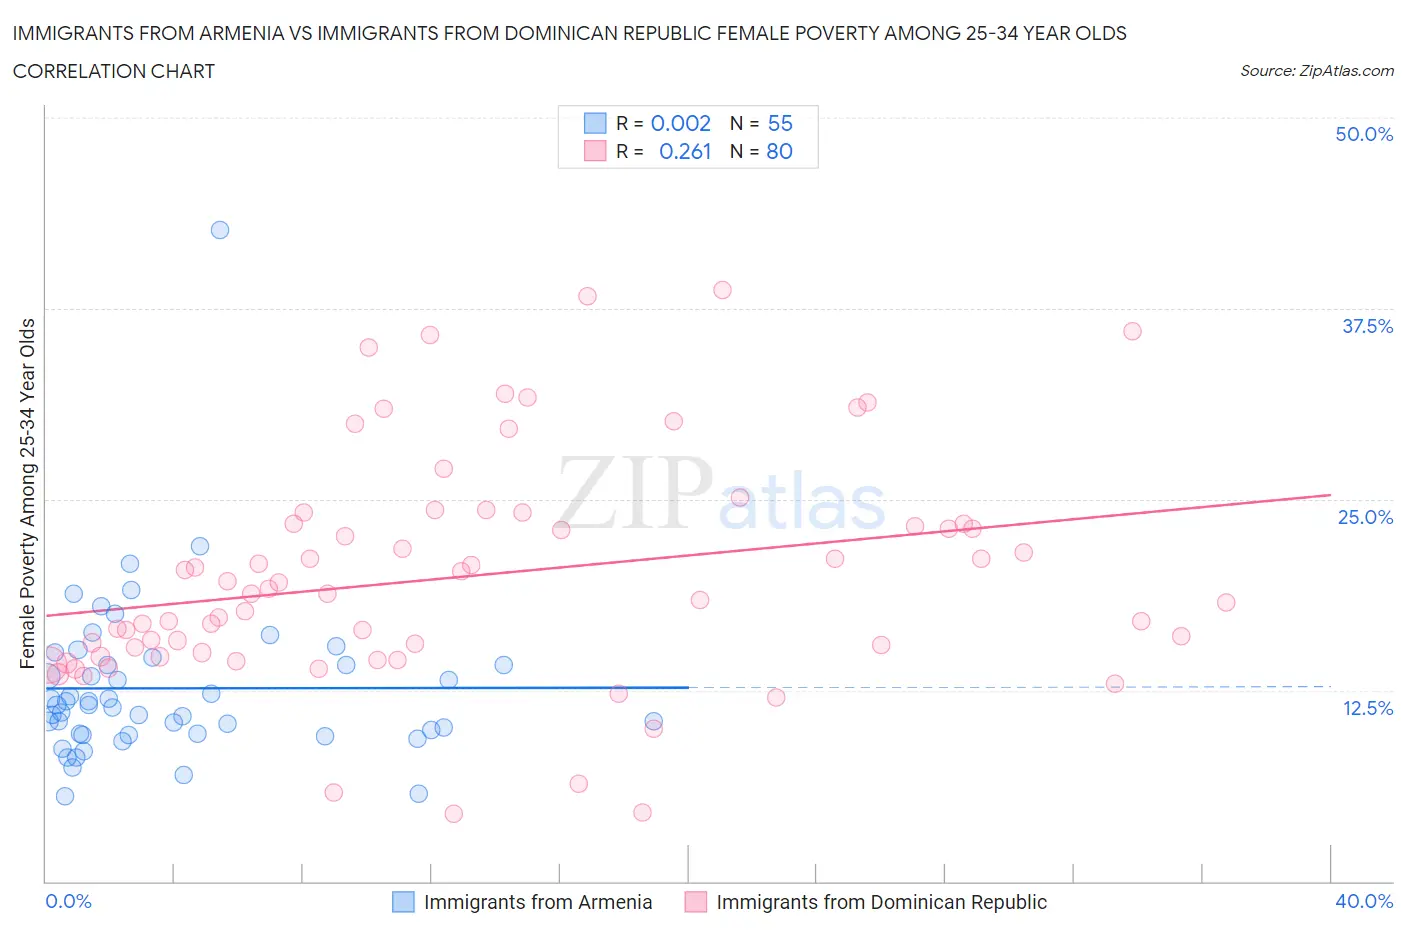
Immigrants from Armenia vs Immigrants from Dominican Republic Female Poverty Among 25-34 Year Olds Correlation Chart
The statistical analysis conducted on geographies consisting of 97,252,675 people shows no correlation between the proportion of Immigrants from Armenia and poverty level among females between the ages 25 and 34 in the United States with a correlation coefficient (R) of 0.002 and weighted average of 12.6%. Similarly, the statistical analysis conducted on geographies consisting of 271,687,729 people shows a weak positive correlation between the proportion of Immigrants from Dominican Republic and poverty level among females between the ages 25 and 34 in the United States with a correlation coefficient (R) of 0.261 and weighted average of 17.6%, a difference of 40.0%.
Female Poverty Among 25-34 Year Olds Correlation Summary
| Measurement | Immigrants from Armenia | Immigrants from Dominican Republic |
| Minimum | 5.6% | 4.4% |
| Maximum | 42.7% | 38.7% |
| Range | 37.1% | 34.3% |
| Mean | 12.6% | 20.0% |
| Median | 11.5% | 18.8% |
| Interquartile 25% (IQ1) | 9.7% | 14.8% |
| Interquartile 75% (IQ3) | 14.2% | 23.4% |
| Interquartile Range (IQR) | 4.5% | 8.5% |
| Standard Deviation (Sample) | 5.4% | 7.5% |
| Standard Deviation (Population) | 5.4% | 7.4% |
Similar Demographics by Female Poverty Among 25-34 Year Olds
Demographics Similar to Immigrants from Armenia by Female Poverty Among 25-34 Year Olds
In terms of female poverty among 25-34 year olds, the demographic groups most similar to Immigrants from Armenia are Norwegian (12.6%, a difference of 0.010%), Palestinian (12.6%, a difference of 0.030%), Immigrants from France (12.6%, a difference of 0.090%), Immigrants from Albania (12.5%, a difference of 0.11%), and Ukrainian (12.6%, a difference of 0.12%).
| Demographics | Rating | Rank | Female Poverty Among 25-34 Year Olds |
| Immigrants | South Eastern Asia | 97.6 /100 | #85 | Exceptional 12.5% |
| Croatians | 97.5 /100 | #86 | Exceptional 12.5% |
| Argentineans | 97.5 /100 | #87 | Exceptional 12.5% |
| Immigrants | Austria | 97.4 /100 | #88 | Exceptional 12.5% |
| Italians | 97.2 /100 | #89 | Exceptional 12.5% |
| Immigrants | Albania | 97.1 /100 | #90 | Exceptional 12.5% |
| Norwegians | 96.9 /100 | #91 | Exceptional 12.6% |
| Immigrants | Armenia | 96.9 /100 | #92 | Exceptional 12.6% |
| Palestinians | 96.9 /100 | #93 | Exceptional 12.6% |
| Immigrants | France | 96.8 /100 | #94 | Exceptional 12.6% |
| Ukrainians | 96.7 /100 | #95 | Exceptional 12.6% |
| Immigrants | Zimbabwe | 96.7 /100 | #96 | Exceptional 12.6% |
| Immigrants | Northern Africa | 96.6 /100 | #97 | Exceptional 12.6% |
| Immigrants | Ethiopia | 96.5 /100 | #98 | Exceptional 12.6% |
| Immigrants | Argentina | 96.4 /100 | #99 | Exceptional 12.6% |
Demographics Similar to Immigrants from Dominican Republic by Female Poverty Among 25-34 Year Olds
In terms of female poverty among 25-34 year olds, the demographic groups most similar to Immigrants from Dominican Republic are Yakama (17.6%, a difference of 0.22%), Dominican (17.6%, a difference of 0.22%), Colville (17.5%, a difference of 0.68%), Iroquois (17.5%, a difference of 0.76%), and Arapaho (17.8%, a difference of 1.0%).
| Demographics | Rating | Rank | Female Poverty Among 25-34 Year Olds |
| Yaqui | 0.0 /100 | #307 | Tragic 17.0% |
| Africans | 0.0 /100 | #308 | Tragic 17.0% |
| Ottawa | 0.0 /100 | #309 | Tragic 17.1% |
| Cherokee | 0.0 /100 | #310 | Tragic 17.2% |
| Immigrants | Honduras | 0.0 /100 | #311 | Tragic 17.3% |
| Iroquois | 0.0 /100 | #312 | Tragic 17.5% |
| Colville | 0.0 /100 | #313 | Tragic 17.5% |
| Immigrants | Dominican Republic | 0.0 /100 | #314 | Tragic 17.6% |
| Yakama | 0.0 /100 | #315 | Tragic 17.6% |
| Dominicans | 0.0 /100 | #316 | Tragic 17.6% |
| Arapaho | 0.0 /100 | #317 | Tragic 17.8% |
| Ute | 0.0 /100 | #318 | Tragic 17.9% |
| Menominee | 0.0 /100 | #319 | Tragic 18.0% |
| Chippewa | 0.0 /100 | #320 | Tragic 18.0% |
| Choctaw | 0.0 /100 | #321 | Tragic 18.1% |