Alaska Native vs Immigrants from Senegal In Labor Force | Age 20-64
COMPARE
Alaska Native
Immigrants from Senegal
In Labor Force | Age 20-64
In Labor Force | Age 20-64 Comparison
Alaska Natives
Immigrants from Senegal
77.0%
IN LABOR FORCE | AGE 20-64
0.0/ 100
METRIC RATING
308th/ 347
METRIC RANK
79.4%
IN LABOR FORCE | AGE 20-64
22.5/ 100
METRIC RATING
197th/ 347
METRIC RANK
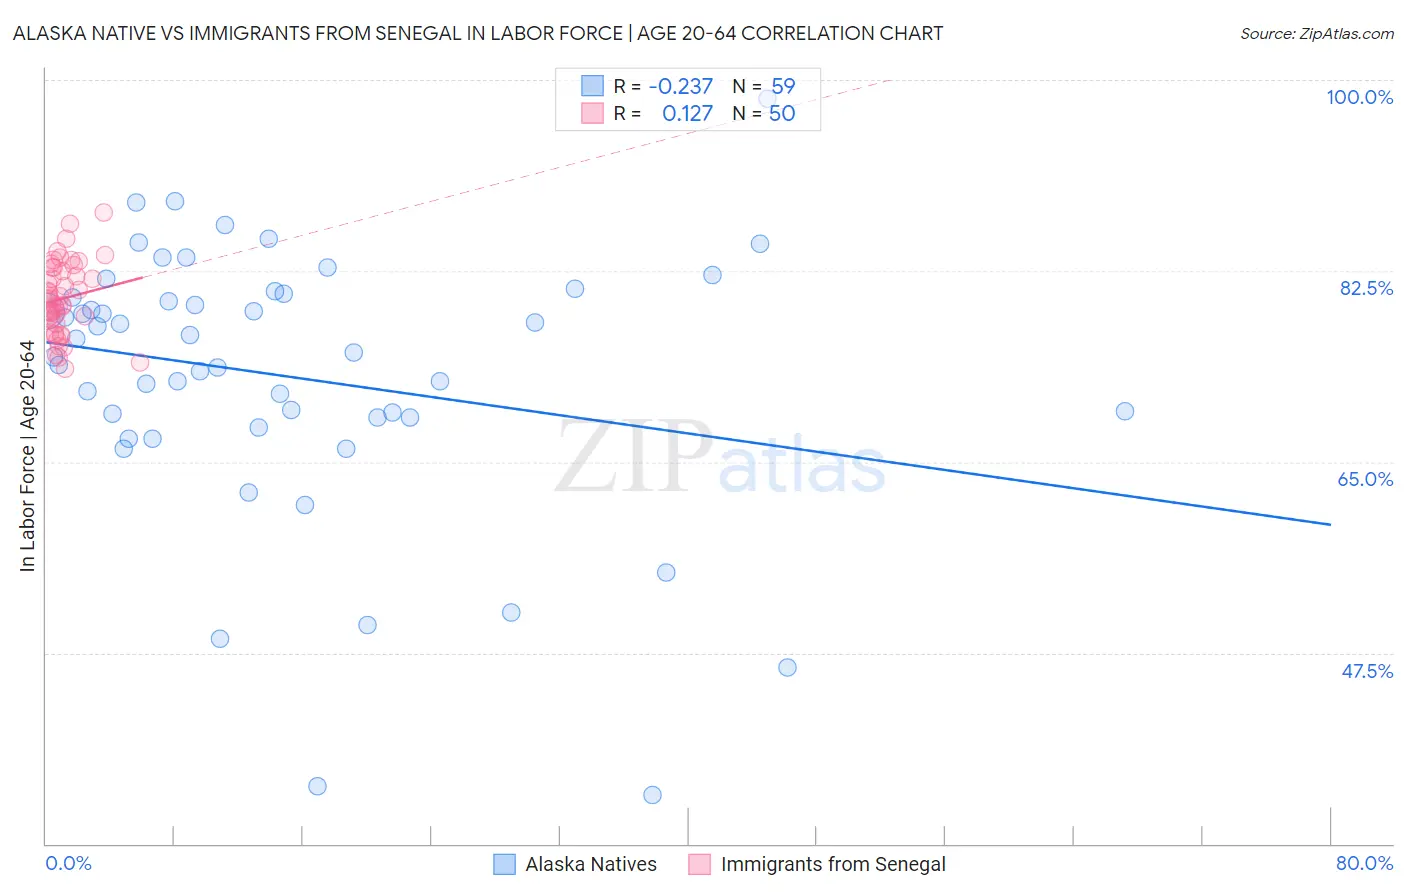
Alaska Native vs Immigrants from Senegal In Labor Force | Age 20-64 Correlation Chart
The statistical analysis conducted on geographies consisting of 76,778,887 people shows a weak negative correlation between the proportion of Alaska Natives and labor force participation rate among population between the ages 20 and 64 in the United States with a correlation coefficient (R) of -0.237 and weighted average of 77.0%. Similarly, the statistical analysis conducted on geographies consisting of 90,128,419 people shows a poor positive correlation between the proportion of Immigrants from Senegal and labor force participation rate among population between the ages 20 and 64 in the United States with a correlation coefficient (R) of 0.127 and weighted average of 79.4%, a difference of 3.0%.
In Labor Force | Age 20-64 Correlation Summary
| Measurement | Alaska Native | Immigrants from Senegal |
| Minimum | 34.5% | 73.6% |
| Maximum | 98.3% | 87.8% |
| Range | 63.8% | 14.2% |
| Mean | 72.8% | 80.0% |
| Median | 75.0% | 79.7% |
| Interquartile 25% (IQ1) | 69.1% | 77.6% |
| Interquartile 75% (IQ3) | 80.4% | 82.8% |
| Interquartile Range (IQR) | 11.3% | 5.1% |
| Standard Deviation (Sample) | 12.4% | 3.3% |
| Standard Deviation (Population) | 12.3% | 3.3% |
Similar Demographics by In Labor Force | Age 20-64
Demographics Similar to Alaska Natives by In Labor Force | Age 20-64
In terms of in labor force | age 20-64, the demographic groups most similar to Alaska Natives are American (77.0%, a difference of 0.010%), Comanche (77.0%, a difference of 0.020%), Central American Indian (77.1%, a difference of 0.060%), Blackfeet (77.0%, a difference of 0.060%), and Potawatomi (77.2%, a difference of 0.23%).
| Demographics | Rating | Rank | In Labor Force | Age 20-64 |
| Nepalese | 0.0 /100 | #301 | Tragic 77.5% |
| Iroquois | 0.0 /100 | #302 | Tragic 77.5% |
| Chippewa | 0.0 /100 | #303 | Tragic 77.3% |
| Immigrants | Mexico | 0.0 /100 | #304 | Tragic 77.3% |
| Mexicans | 0.0 /100 | #305 | Tragic 77.2% |
| Potawatomi | 0.0 /100 | #306 | Tragic 77.2% |
| Central American Indians | 0.0 /100 | #307 | Tragic 77.1% |
| Alaska Natives | 0.0 /100 | #308 | Tragic 77.0% |
| Americans | 0.0 /100 | #309 | Tragic 77.0% |
| Comanche | 0.0 /100 | #310 | Tragic 77.0% |
| Blackfeet | 0.0 /100 | #311 | Tragic 77.0% |
| Alaskan Athabascans | 0.0 /100 | #312 | Tragic 76.9% |
| Shoshone | 0.0 /100 | #313 | Tragic 76.8% |
| Blacks/African Americans | 0.0 /100 | #314 | Tragic 76.8% |
| Ottawa | 0.0 /100 | #315 | Tragic 76.7% |
Demographics Similar to Immigrants from Senegal by In Labor Force | Age 20-64
In terms of in labor force | age 20-64, the demographic groups most similar to Immigrants from Senegal are Immigrants from Austria (79.4%, a difference of 0.010%), Ecuadorian (79.4%, a difference of 0.010%), Immigrants from Laos (79.4%, a difference of 0.010%), Immigrants from Thailand (79.4%, a difference of 0.020%), and Dutch (79.3%, a difference of 0.030%).
| Demographics | Rating | Rank | In Labor Force | Age 20-64 |
| Immigrants | Syria | 30.8 /100 | #190 | Fair 79.4% |
| Swiss | 28.9 /100 | #191 | Fair 79.4% |
| Immigrants | Denmark | 26.9 /100 | #192 | Fair 79.4% |
| Indonesians | 26.1 /100 | #193 | Fair 79.4% |
| Immigrants | Thailand | 24.8 /100 | #194 | Fair 79.4% |
| Immigrants | Austria | 23.7 /100 | #195 | Fair 79.4% |
| Ecuadorians | 23.1 /100 | #196 | Fair 79.4% |
| Immigrants | Senegal | 22.5 /100 | #197 | Fair 79.4% |
| Immigrants | Laos | 21.5 /100 | #198 | Fair 79.4% |
| Dutch | 20.2 /100 | #199 | Fair 79.3% |
| Immigrants | Oceania | 19.1 /100 | #200 | Poor 79.3% |
| Immigrants | Nicaragua | 19.0 /100 | #201 | Poor 79.3% |
| Nicaraguans | 18.3 /100 | #202 | Poor 79.3% |
| Iraqis | 17.7 /100 | #203 | Poor 79.3% |
| Immigrants | Cambodia | 17.6 /100 | #204 | Poor 79.3% |