Immigrants from Italy vs Immigrants from Senegal Family Poverty
COMPARE
Immigrants from Italy
Immigrants from Senegal
Family Poverty
Family Poverty Comparison
Immigrants from Italy
Immigrants from Senegal
8.0%
FAMILY POVERTY
97.0/ 100
METRIC RATING
91st/ 347
METRIC RANK
11.7%
FAMILY POVERTY
0.0/ 100
METRIC RATING
298th/ 347
METRIC RANK
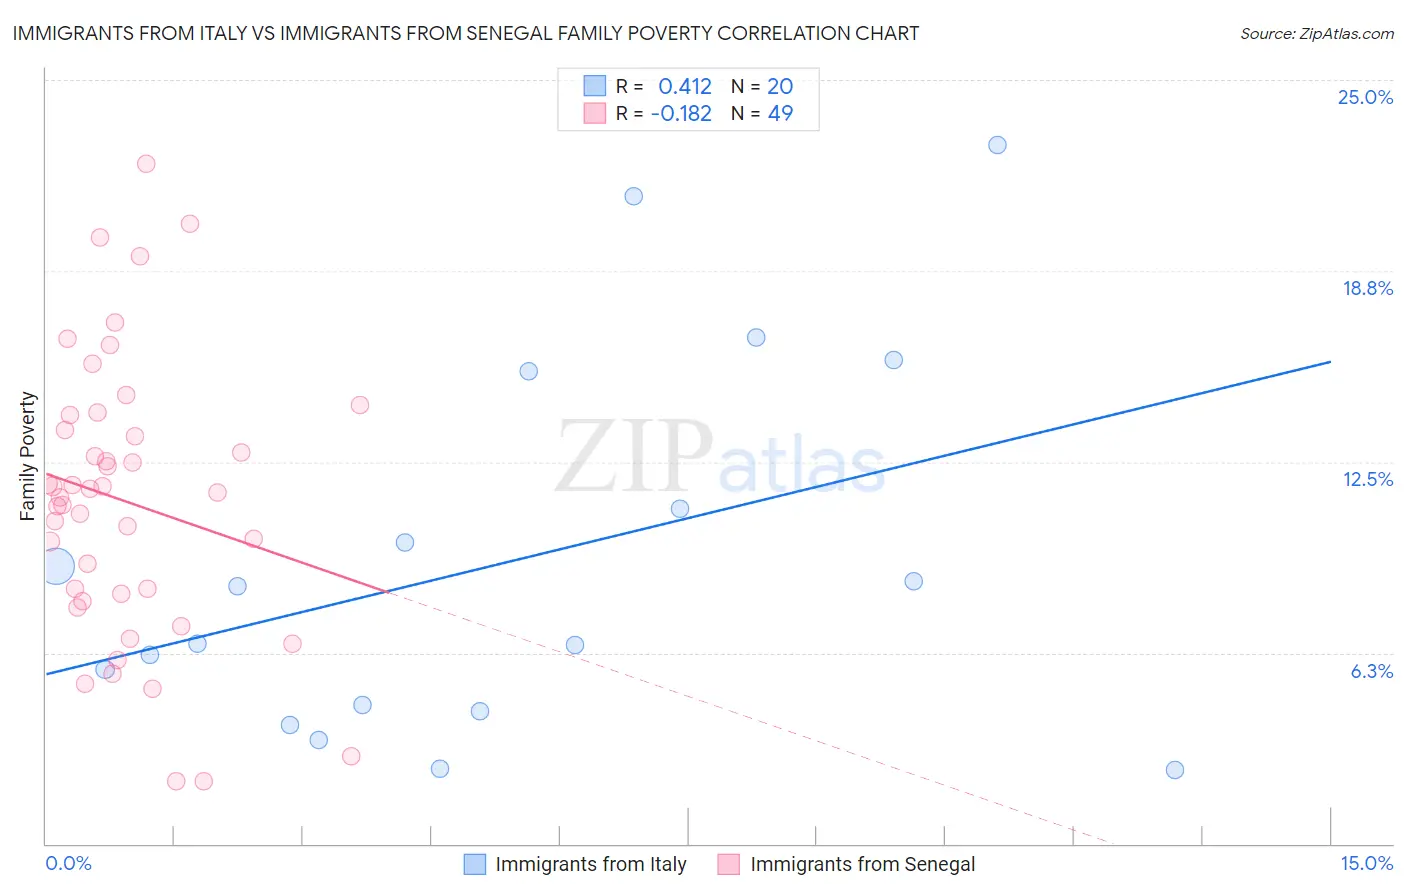
Immigrants from Italy vs Immigrants from Senegal Family Poverty Correlation Chart
The statistical analysis conducted on geographies consisting of 323,411,315 people shows a moderate positive correlation between the proportion of Immigrants from Italy and poverty level among families in the United States with a correlation coefficient (R) of 0.412 and weighted average of 8.0%. Similarly, the statistical analysis conducted on geographies consisting of 90,075,938 people shows a poor negative correlation between the proportion of Immigrants from Senegal and poverty level among families in the United States with a correlation coefficient (R) of -0.182 and weighted average of 11.7%, a difference of 46.2%.
Family Poverty Correlation Summary
| Measurement | Immigrants from Italy | Immigrants from Senegal |
| Minimum | 2.4% | 2.0% |
| Maximum | 22.9% | 22.3% |
| Range | 20.5% | 20.2% |
| Mean | 9.2% | 11.2% |
| Median | 7.5% | 11.5% |
| Interquartile 25% (IQ1) | 4.4% | 8.1% |
| Interquartile 75% (IQ3) | 13.2% | 13.8% |
| Interquartile Range (IQR) | 8.8% | 5.7% |
| Standard Deviation (Sample) | 6.1% | 4.6% |
| Standard Deviation (Population) | 5.9% | 4.5% |
Similar Demographics by Family Poverty
Demographics Similar to Immigrants from Italy by Family Poverty
In terms of family poverty, the demographic groups most similar to Immigrants from Italy are Immigrants from Denmark (8.0%, a difference of 0.16%), Immigrants from England (8.0%, a difference of 0.16%), Czechoslovakian (8.0%, a difference of 0.24%), Serbian (8.0%, a difference of 0.31%), and Belgian (8.0%, a difference of 0.37%).
| Demographics | Rating | Rank | Family Poverty |
| British | 97.5 /100 | #84 | Exceptional 7.9% |
| Immigrants | Asia | 97.4 /100 | #85 | Exceptional 7.9% |
| Scottish | 97.3 /100 | #86 | Exceptional 7.9% |
| Belgians | 97.3 /100 | #87 | Exceptional 8.0% |
| Serbians | 97.2 /100 | #88 | Exceptional 8.0% |
| Immigrants | Denmark | 97.1 /100 | #89 | Exceptional 8.0% |
| Immigrants | England | 97.1 /100 | #90 | Exceptional 8.0% |
| Immigrants | Italy | 97.0 /100 | #91 | Exceptional 8.0% |
| Czechoslovakians | 96.8 /100 | #92 | Exceptional 8.0% |
| Tlingit-Haida | 96.7 /100 | #93 | Exceptional 8.0% |
| Immigrants | Pakistan | 96.6 /100 | #94 | Exceptional 8.0% |
| Immigrants | Philippines | 96.5 /100 | #95 | Exceptional 8.0% |
| Immigrants | Turkey | 96.5 /100 | #96 | Exceptional 8.0% |
| Immigrants | Switzerland | 96.1 /100 | #97 | Exceptional 8.1% |
| Immigrants | South Africa | 95.9 /100 | #98 | Exceptional 8.1% |
Demographics Similar to Immigrants from Senegal by Family Poverty
In terms of family poverty, the demographic groups most similar to Immigrants from Senegal are Dutch West Indian (11.7%, a difference of 0.10%), Immigrants from Bangladesh (11.7%, a difference of 0.11%), Creek (11.7%, a difference of 0.14%), Bahamian (11.7%, a difference of 0.36%), and Choctaw (11.6%, a difference of 0.37%).
| Demographics | Rating | Rank | Family Poverty |
| Haitians | 0.0 /100 | #291 | Tragic 11.5% |
| Immigrants | Somalia | 0.0 /100 | #292 | Tragic 11.5% |
| Immigrants | Cabo Verde | 0.0 /100 | #293 | Tragic 11.6% |
| Immigrants | St. Vincent and the Grenadines | 0.0 /100 | #294 | Tragic 11.6% |
| Immigrants | Haiti | 0.0 /100 | #295 | Tragic 11.6% |
| Choctaw | 0.0 /100 | #296 | Tragic 11.6% |
| Creek | 0.0 /100 | #297 | Tragic 11.7% |
| Immigrants | Senegal | 0.0 /100 | #298 | Tragic 11.7% |
| Dutch West Indians | 0.0 /100 | #299 | Tragic 11.7% |
| Immigrants | Bangladesh | 0.0 /100 | #300 | Tragic 11.7% |
| Bahamians | 0.0 /100 | #301 | Tragic 11.7% |
| Guatemalans | 0.0 /100 | #302 | Tragic 11.7% |
| Africans | 0.0 /100 | #303 | Tragic 11.8% |
| Immigrants | Latin America | 0.0 /100 | #304 | Tragic 11.8% |
| Mexicans | 0.0 /100 | #305 | Tragic 11.8% |