Belgian vs Immigrants from Senegal Family Poverty
COMPARE
Belgian
Immigrants from Senegal
Family Poverty
Family Poverty Comparison
Belgians
Immigrants from Senegal
8.0%
FAMILY POVERTY
97.3/ 100
METRIC RATING
87th/ 347
METRIC RANK
11.7%
FAMILY POVERTY
0.0/ 100
METRIC RATING
298th/ 347
METRIC RANK
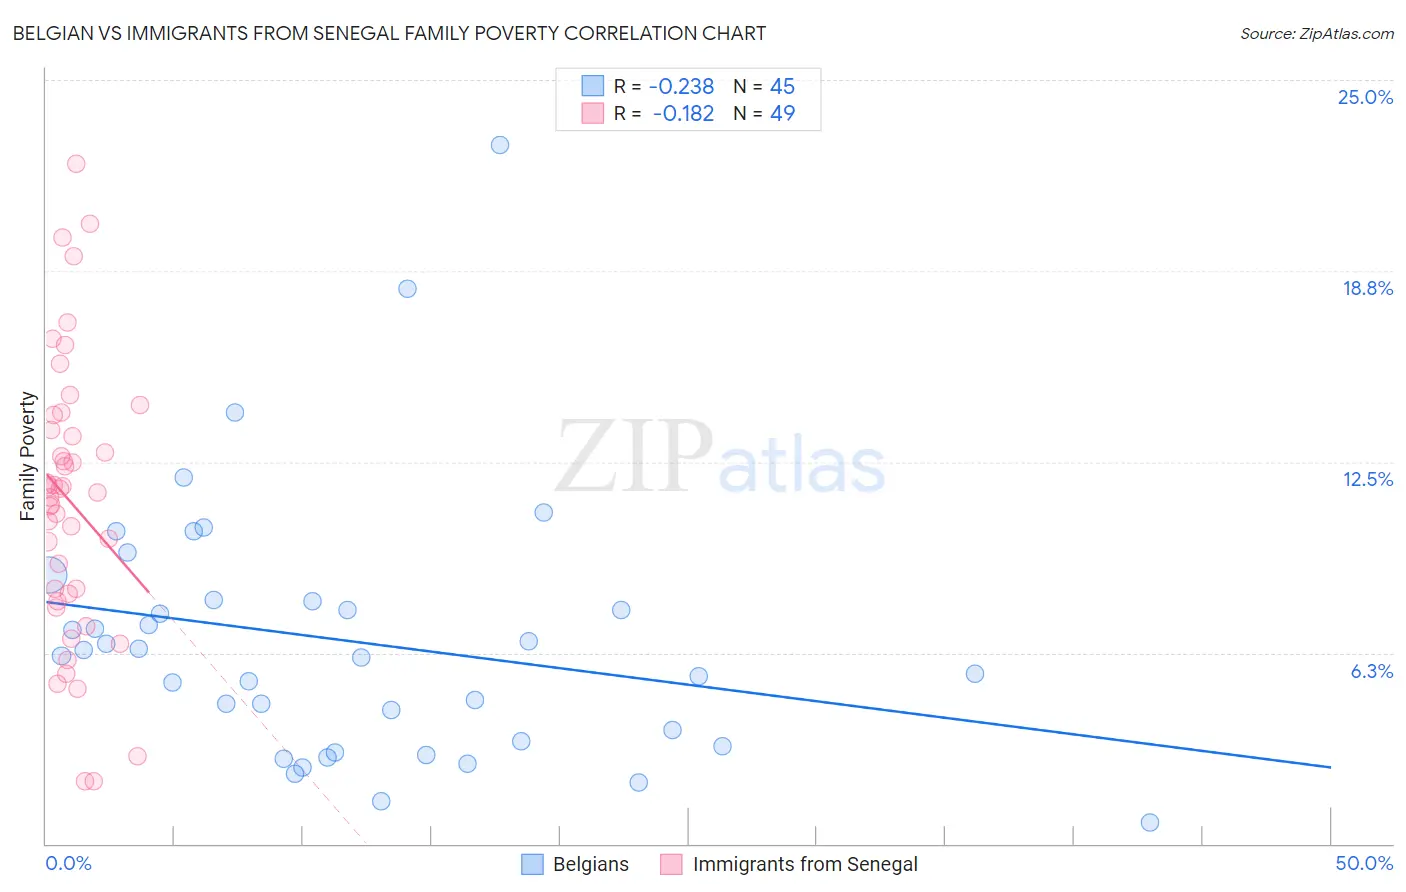
Belgian vs Immigrants from Senegal Family Poverty Correlation Chart
The statistical analysis conducted on geographies consisting of 355,051,863 people shows a weak negative correlation between the proportion of Belgians and poverty level among families in the United States with a correlation coefficient (R) of -0.238 and weighted average of 8.0%. Similarly, the statistical analysis conducted on geographies consisting of 90,075,938 people shows a poor negative correlation between the proportion of Immigrants from Senegal and poverty level among families in the United States with a correlation coefficient (R) of -0.182 and weighted average of 11.7%, a difference of 46.7%.
Family Poverty Correlation Summary
| Measurement | Belgian | Immigrants from Senegal |
| Minimum | 0.68% | 2.0% |
| Maximum | 22.9% | 22.3% |
| Range | 22.2% | 20.2% |
| Mean | 6.6% | 11.2% |
| Median | 6.2% | 11.5% |
| Interquartile 25% (IQ1) | 3.3% | 8.1% |
| Interquartile 75% (IQ3) | 8.0% | 13.8% |
| Interquartile Range (IQR) | 4.7% | 5.7% |
| Standard Deviation (Sample) | 4.3% | 4.6% |
| Standard Deviation (Population) | 4.2% | 4.5% |
Similar Demographics by Family Poverty
Demographics Similar to Belgians by Family Poverty
In terms of family poverty, the demographic groups most similar to Belgians are Serbian (8.0%, a difference of 0.070%), Scottish (7.9%, a difference of 0.090%), Immigrants from Asia (7.9%, a difference of 0.13%), Immigrants from Denmark (8.0%, a difference of 0.21%), and Immigrants from England (8.0%, a difference of 0.21%).
| Demographics | Rating | Rank | Family Poverty |
| English | 97.8 /100 | #80 | Exceptional 7.9% |
| Irish | 97.8 /100 | #81 | Exceptional 7.9% |
| Immigrants | Poland | 97.8 /100 | #82 | Exceptional 7.9% |
| Slovaks | 97.7 /100 | #83 | Exceptional 7.9% |
| British | 97.5 /100 | #84 | Exceptional 7.9% |
| Immigrants | Asia | 97.4 /100 | #85 | Exceptional 7.9% |
| Scottish | 97.3 /100 | #86 | Exceptional 7.9% |
| Belgians | 97.3 /100 | #87 | Exceptional 8.0% |
| Serbians | 97.2 /100 | #88 | Exceptional 8.0% |
| Immigrants | Denmark | 97.1 /100 | #89 | Exceptional 8.0% |
| Immigrants | England | 97.1 /100 | #90 | Exceptional 8.0% |
| Immigrants | Italy | 97.0 /100 | #91 | Exceptional 8.0% |
| Czechoslovakians | 96.8 /100 | #92 | Exceptional 8.0% |
| Tlingit-Haida | 96.7 /100 | #93 | Exceptional 8.0% |
| Immigrants | Pakistan | 96.6 /100 | #94 | Exceptional 8.0% |
Demographics Similar to Immigrants from Senegal by Family Poverty
In terms of family poverty, the demographic groups most similar to Immigrants from Senegal are Dutch West Indian (11.7%, a difference of 0.10%), Immigrants from Bangladesh (11.7%, a difference of 0.11%), Creek (11.7%, a difference of 0.14%), Bahamian (11.7%, a difference of 0.36%), and Choctaw (11.6%, a difference of 0.37%).
| Demographics | Rating | Rank | Family Poverty |
| Haitians | 0.0 /100 | #291 | Tragic 11.5% |
| Immigrants | Somalia | 0.0 /100 | #292 | Tragic 11.5% |
| Immigrants | Cabo Verde | 0.0 /100 | #293 | Tragic 11.6% |
| Immigrants | St. Vincent and the Grenadines | 0.0 /100 | #294 | Tragic 11.6% |
| Immigrants | Haiti | 0.0 /100 | #295 | Tragic 11.6% |
| Choctaw | 0.0 /100 | #296 | Tragic 11.6% |
| Creek | 0.0 /100 | #297 | Tragic 11.7% |
| Immigrants | Senegal | 0.0 /100 | #298 | Tragic 11.7% |
| Dutch West Indians | 0.0 /100 | #299 | Tragic 11.7% |
| Immigrants | Bangladesh | 0.0 /100 | #300 | Tragic 11.7% |
| Bahamians | 0.0 /100 | #301 | Tragic 11.7% |
| Guatemalans | 0.0 /100 | #302 | Tragic 11.7% |
| Africans | 0.0 /100 | #303 | Tragic 11.8% |
| Immigrants | Latin America | 0.0 /100 | #304 | Tragic 11.8% |
| Mexicans | 0.0 /100 | #305 | Tragic 11.8% |