Alaska Native vs Immigrants from Senegal Median Family Income
COMPARE
Alaska Native
Immigrants from Senegal
Median Family Income
Median Family Income Comparison
Alaska Natives
Immigrants from Senegal
$95,573
MEDIAN FAMILY INCOME
2.6/ 100
METRIC RATING
227th/ 347
METRIC RANK
$92,912
MEDIAN FAMILY INCOME
0.7/ 100
METRIC RATING
247th/ 347
METRIC RANK
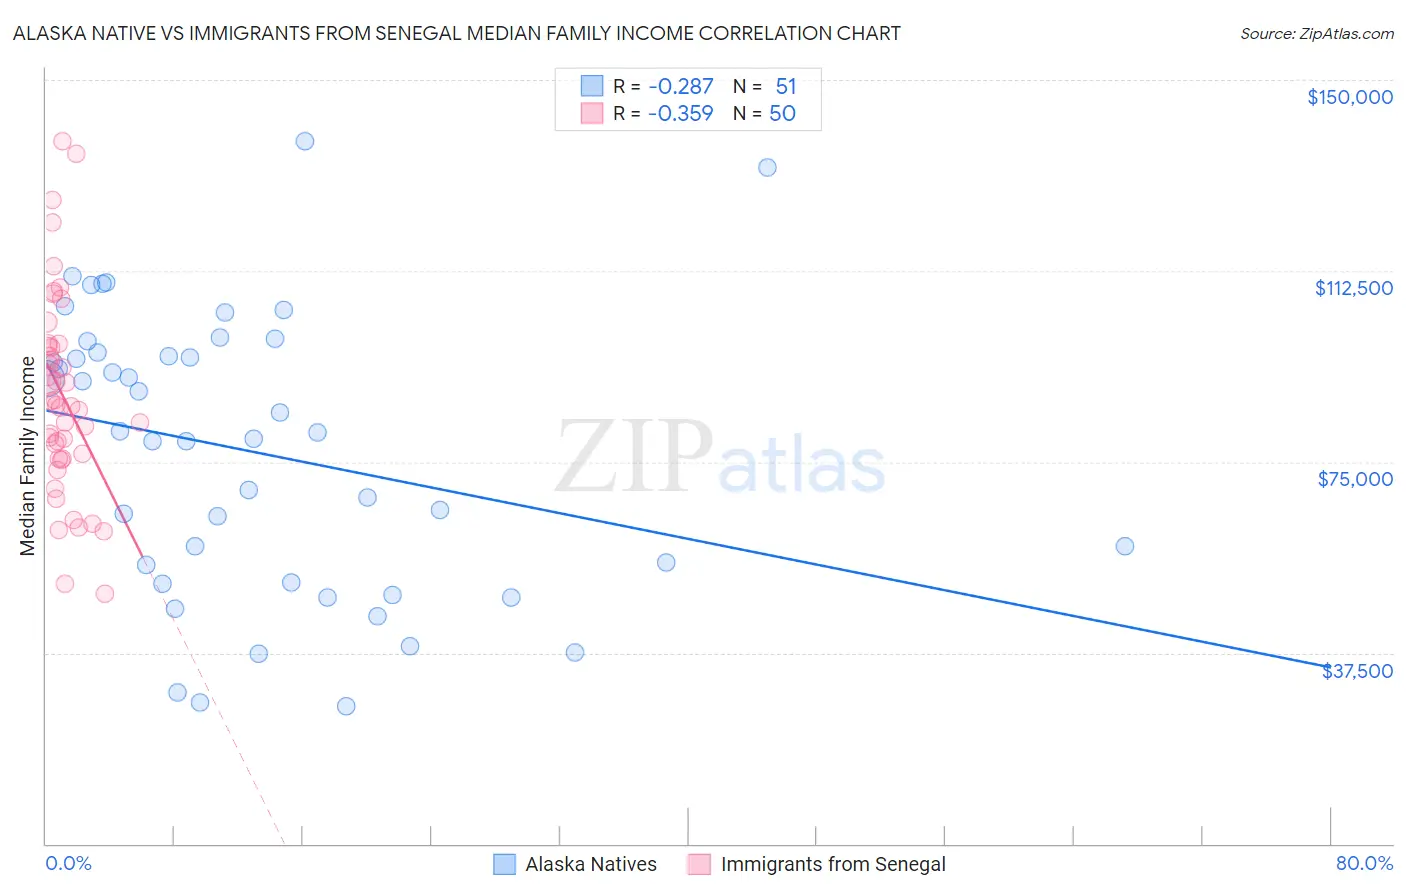
Alaska Native vs Immigrants from Senegal Median Family Income Correlation Chart
The statistical analysis conducted on geographies consisting of 76,737,851 people shows a weak negative correlation between the proportion of Alaska Natives and median family income in the United States with a correlation coefficient (R) of -0.287 and weighted average of $95,573. Similarly, the statistical analysis conducted on geographies consisting of 90,105,018 people shows a mild negative correlation between the proportion of Immigrants from Senegal and median family income in the United States with a correlation coefficient (R) of -0.359 and weighted average of $92,912, a difference of 2.9%.
Median Family Income Correlation Summary
| Measurement | Alaska Native | Immigrants from Senegal |
| Minimum | $27,083 | $49,167 |
| Maximum | $137,917 | $137,892 |
| Range | $110,834 | $88,725 |
| Mean | $77,054 | $87,849 |
| Median | $80,833 | $85,966 |
| Interquartile 25% (IQ1) | $51,316 | $75,730 |
| Interquartile 75% (IQ3) | $96,369 | $97,800 |
| Interquartile Range (IQR) | $45,053 | $22,070 |
| Standard Deviation (Sample) | $27,527 | $19,522 |
| Standard Deviation (Population) | $27,256 | $19,326 |
Demographics Similar to Alaska Natives and Immigrants from Senegal by Median Family Income
In terms of median family income, the demographic groups most similar to Alaska Natives are Immigrants from the Azores ($95,402, a difference of 0.18%), Marshallese ($95,293, a difference of 0.29%), Malaysian ($95,230, a difference of 0.36%), Ecuadorian ($95,114, a difference of 0.48%), and Immigrants from Venezuela ($94,904, a difference of 0.70%). Similarly, the demographic groups most similar to Immigrants from Senegal are Guyanese ($93,373, a difference of 0.50%), Immigrants from Middle Africa ($93,593, a difference of 0.73%), Subsaharan African ($93,748, a difference of 0.90%), German Russian ($93,858, a difference of 1.0%), and Barbadian ($93,919, a difference of 1.1%).
| Demographics | Rating | Rank | Median Family Income |
| Alaska Natives | 2.6 /100 | #227 | Tragic $95,573 |
| Immigrants | Azores | 2.4 /100 | #228 | Tragic $95,402 |
| Marshallese | 2.2 /100 | #229 | Tragic $95,293 |
| Malaysians | 2.2 /100 | #230 | Tragic $95,230 |
| Ecuadorians | 2.1 /100 | #231 | Tragic $95,114 |
| Immigrants | Venezuela | 1.9 /100 | #232 | Tragic $94,904 |
| Immigrants | Bangladesh | 1.6 /100 | #233 | Tragic $94,665 |
| Immigrants | Western Africa | 1.6 /100 | #234 | Tragic $94,638 |
| Immigrants | Burma/Myanmar | 1.5 /100 | #235 | Tragic $94,472 |
| Trinidadians and Tobagonians | 1.5 /100 | #236 | Tragic $94,466 |
| Alaskan Athabascans | 1.5 /100 | #237 | Tragic $94,429 |
| Nepalese | 1.3 /100 | #238 | Tragic $94,153 |
| Salvadorans | 1.2 /100 | #239 | Tragic $94,109 |
| Somalis | 1.2 /100 | #240 | Tragic $94,085 |
| Immigrants | Trinidad and Tobago | 1.2 /100 | #241 | Tragic $93,988 |
| Barbadians | 1.1 /100 | #242 | Tragic $93,919 |
| German Russians | 1.1 /100 | #243 | Tragic $93,858 |
| Sub-Saharan Africans | 1.0 /100 | #244 | Tragic $93,748 |
| Immigrants | Middle Africa | 1.0 /100 | #245 | Tragic $93,593 |
| Guyanese | 0.9 /100 | #246 | Tragic $93,373 |
| Immigrants | Senegal | 0.7 /100 | #247 | Tragic $92,912 |