Alaska Native vs Immigrants from Senegal Unemployment Among Ages 35 to 44 years
COMPARE
Alaska Native
Immigrants from Senegal
Unemployment Among Ages 35 to 44 years
Unemployment Among Ages 35 to 44 years Comparison
Alaska Natives
Immigrants from Senegal
6.6%
UNEMPLOYMENT AMONG AGES 35 TO 44 YEARS
0.0/ 100
METRIC RATING
326th/ 347
METRIC RANK
5.4%
UNEMPLOYMENT AMONG AGES 35 TO 44 YEARS
0.0/ 100
METRIC RATING
279th/ 347
METRIC RANK
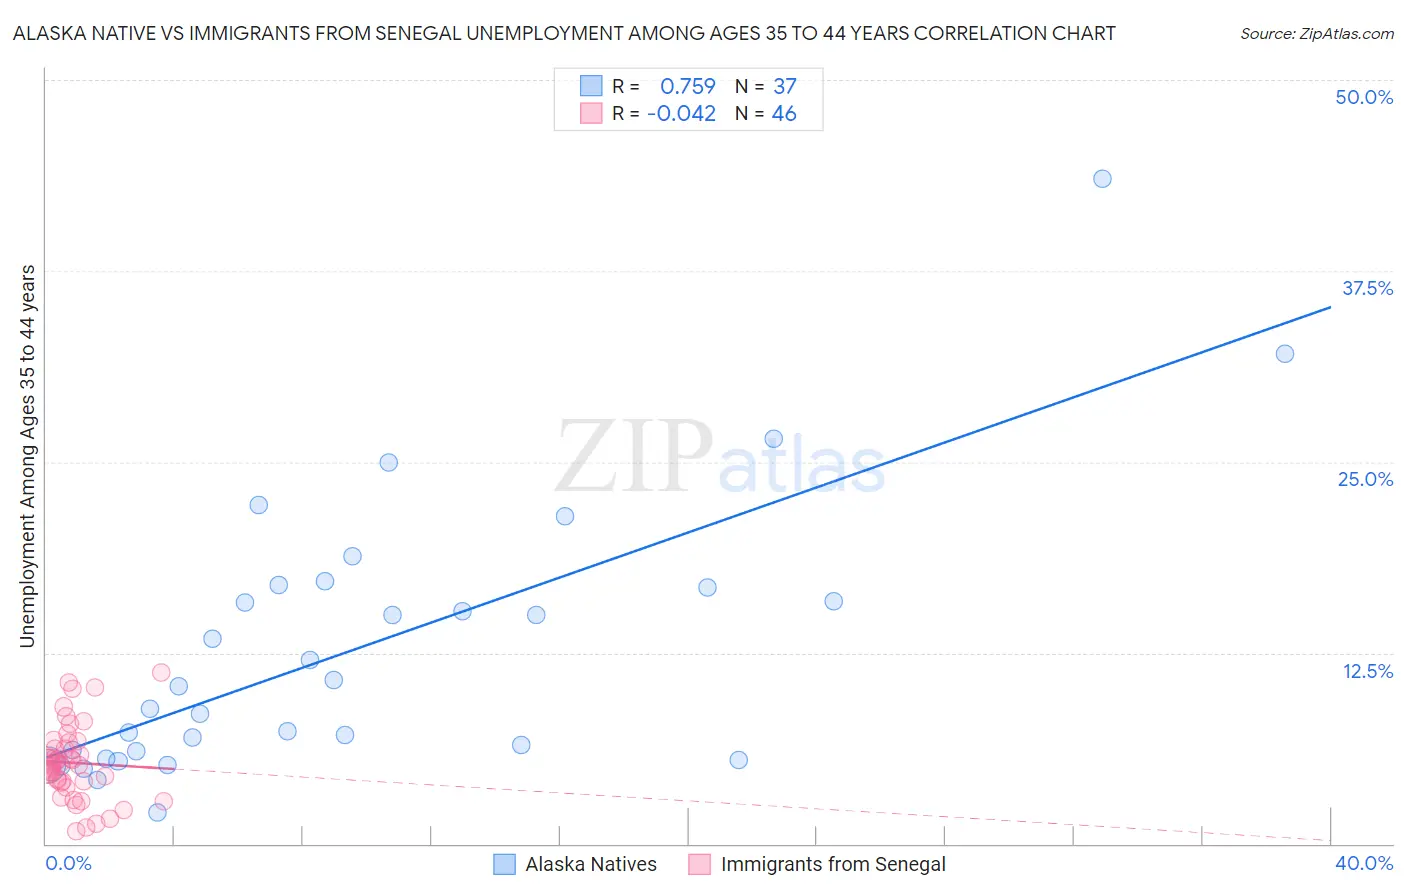
Alaska Native vs Immigrants from Senegal Unemployment Among Ages 35 to 44 years Correlation Chart
The statistical analysis conducted on geographies consisting of 76,108,563 people shows a strong positive correlation between the proportion of Alaska Natives and unemployment rate among population between the ages 35 and 44 in the United States with a correlation coefficient (R) of 0.759 and weighted average of 6.6%. Similarly, the statistical analysis conducted on geographies consisting of 89,848,104 people shows no correlation between the proportion of Immigrants from Senegal and unemployment rate among population between the ages 35 and 44 in the United States with a correlation coefficient (R) of -0.042 and weighted average of 5.4%, a difference of 21.8%.
Unemployment Among Ages 35 to 44 years Correlation Summary
| Measurement | Alaska Native | Immigrants from Senegal |
| Minimum | 2.0% | 0.80% |
| Maximum | 43.5% | 11.2% |
| Range | 41.5% | 10.4% |
| Mean | 12.7% | 5.3% |
| Median | 10.3% | 5.2% |
| Interquartile 25% (IQ1) | 5.8% | 4.0% |
| Interquartile 75% (IQ3) | 16.9% | 6.6% |
| Interquartile Range (IQR) | 11.0% | 2.6% |
| Standard Deviation (Sample) | 8.9% | 2.5% |
| Standard Deviation (Population) | 8.7% | 2.5% |
Similar Demographics by Unemployment Among Ages 35 to 44 years
Demographics Similar to Alaska Natives by Unemployment Among Ages 35 to 44 years
In terms of unemployment among ages 35 to 44 years, the demographic groups most similar to Alaska Natives are Cape Verdean (6.6%, a difference of 0.050%), Immigrants from Yemen (6.6%, a difference of 0.070%), Menominee (6.5%, a difference of 0.43%), Shoshone (6.6%, a difference of 0.74%), and Dominican (6.4%, a difference of 2.0%).
| Demographics | Rating | Rank | Unemployment Among Ages 35 to 44 years |
| Immigrants | Grenada | 0.0 /100 | #319 | Tragic 6.2% |
| Immigrants | Armenia | 0.0 /100 | #320 | Tragic 6.2% |
| Chippewa | 0.0 /100 | #321 | Tragic 6.2% |
| Immigrants | Dominican Republic | 0.0 /100 | #322 | Tragic 6.4% |
| Dominicans | 0.0 /100 | #323 | Tragic 6.4% |
| Menominee | 0.0 /100 | #324 | Tragic 6.5% |
| Immigrants | Yemen | 0.0 /100 | #325 | Tragic 6.6% |
| Alaska Natives | 0.0 /100 | #326 | Tragic 6.6% |
| Cape Verdeans | 0.0 /100 | #327 | Tragic 6.6% |
| Shoshone | 0.0 /100 | #328 | Tragic 6.6% |
| Paiute | 0.0 /100 | #329 | Tragic 6.9% |
| Immigrants | Cabo Verde | 0.0 /100 | #330 | Tragic 6.9% |
| Pueblo | 0.0 /100 | #331 | Tragic 7.1% |
| Natives/Alaskans | 0.0 /100 | #332 | Tragic 7.3% |
| Puerto Ricans | 0.0 /100 | #333 | Tragic 7.6% |
Demographics Similar to Immigrants from Senegal by Unemployment Among Ages 35 to 44 years
In terms of unemployment among ages 35 to 44 years, the demographic groups most similar to Immigrants from Senegal are Lumbee (5.4%, a difference of 0.060%), Ecuadorian (5.4%, a difference of 0.17%), Immigrants from Portugal (5.4%, a difference of 0.21%), Immigrants from Caribbean (5.4%, a difference of 0.29%), and Native Hawaiian (5.4%, a difference of 0.36%).
| Demographics | Rating | Rank | Unemployment Among Ages 35 to 44 years |
| Senegalese | 0.0 /100 | #272 | Tragic 5.3% |
| Vietnamese | 0.0 /100 | #273 | Tragic 5.4% |
| Creek | 0.0 /100 | #274 | Tragic 5.4% |
| Immigrants | Mexico | 0.0 /100 | #275 | Tragic 5.4% |
| Native Hawaiians | 0.0 /100 | #276 | Tragic 5.4% |
| Immigrants | Caribbean | 0.0 /100 | #277 | Tragic 5.4% |
| Lumbee | 0.0 /100 | #278 | Tragic 5.4% |
| Immigrants | Senegal | 0.0 /100 | #279 | Tragic 5.4% |
| Ecuadorians | 0.0 /100 | #280 | Tragic 5.4% |
| Immigrants | Portugal | 0.0 /100 | #281 | Tragic 5.4% |
| Immigrants | Ghana | 0.0 /100 | #282 | Tragic 5.4% |
| Immigrants | Ecuador | 0.0 /100 | #283 | Tragic 5.4% |
| Haitians | 0.0 /100 | #284 | Tragic 5.5% |
| Hispanics or Latinos | 0.0 /100 | #285 | Tragic 5.5% |
| Immigrants | Micronesia | 0.0 /100 | #286 | Tragic 5.5% |