Alaska Native vs Asian Single Mother Poverty
COMPARE
Alaska Native
Asian
Single Mother Poverty
Single Mother Poverty Comparison
Alaska Natives
Asians
30.9%
SINGLE MOTHER POVERTY
0.6/ 100
METRIC RATING
252nd/ 347
METRIC RANK
26.0%
SINGLE MOTHER POVERTY
100.0/ 100
METRIC RATING
17th/ 347
METRIC RANK
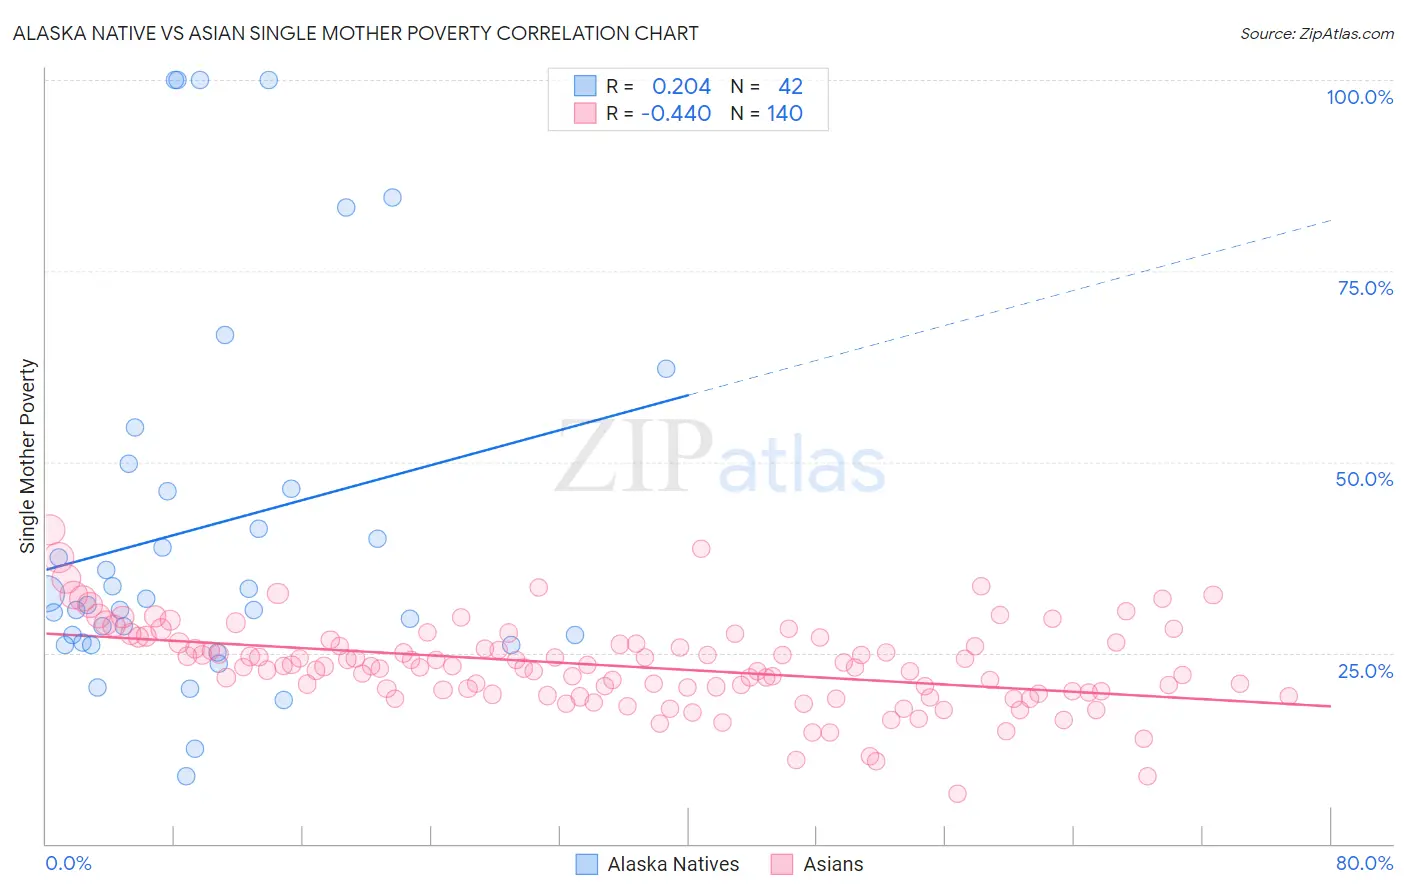
Alaska Native vs Asian Single Mother Poverty Correlation Chart
The statistical analysis conducted on geographies consisting of 76,488,214 people shows a weak positive correlation between the proportion of Alaska Natives and poverty level among single mothers in the United States with a correlation coefficient (R) of 0.204 and weighted average of 30.9%. Similarly, the statistical analysis conducted on geographies consisting of 527,260,509 people shows a moderate negative correlation between the proportion of Asians and poverty level among single mothers in the United States with a correlation coefficient (R) of -0.440 and weighted average of 26.0%, a difference of 19.1%.
Single Mother Poverty Correlation Summary
| Measurement | Alaska Native | Asian |
| Minimum | 8.8% | 6.6% |
| Maximum | 100.0% | 41.1% |
| Range | 91.2% | 34.6% |
| Mean | 41.6% | 23.3% |
| Median | 31.7% | 23.3% |
| Interquartile 25% (IQ1) | 26.3% | 19.9% |
| Interquartile 75% (IQ3) | 46.5% | 26.4% |
| Interquartile Range (IQR) | 20.2% | 6.5% |
| Standard Deviation (Sample) | 24.9% | 5.6% |
| Standard Deviation (Population) | 24.6% | 5.6% |
Similar Demographics by Single Mother Poverty
Demographics Similar to Alaska Natives by Single Mother Poverty
In terms of single mother poverty, the demographic groups most similar to Alaska Natives are Tlingit-Haida (30.9%, a difference of 0.010%), Celtic (30.9%, a difference of 0.030%), Vietnamese (30.9%, a difference of 0.13%), Senegalese (31.0%, a difference of 0.18%), and Cape Verdean (30.8%, a difference of 0.28%).
| Demographics | Rating | Rank | Single Mother Poverty |
| Barbadians | 1.3 /100 | #245 | Tragic 30.7% |
| Ecuadorians | 0.9 /100 | #246 | Tragic 30.8% |
| West Indians | 0.9 /100 | #247 | Tragic 30.8% |
| French Canadians | 0.9 /100 | #248 | Tragic 30.8% |
| Cape Verdeans | 0.8 /100 | #249 | Tragic 30.8% |
| Vietnamese | 0.7 /100 | #250 | Tragic 30.9% |
| Tlingit-Haida | 0.6 /100 | #251 | Tragic 30.9% |
| Alaska Natives | 0.6 /100 | #252 | Tragic 30.9% |
| Celtics | 0.6 /100 | #253 | Tragic 30.9% |
| Senegalese | 0.5 /100 | #254 | Tragic 31.0% |
| Belizeans | 0.5 /100 | #255 | Tragic 31.0% |
| Immigrants | West Indies | 0.4 /100 | #256 | Tragic 31.1% |
| Immigrants | Bahamas | 0.4 /100 | #257 | Tragic 31.1% |
| Immigrants | Caribbean | 0.4 /100 | #258 | Tragic 31.1% |
| Immigrants | Bangladesh | 0.4 /100 | #259 | Tragic 31.1% |
Demographics Similar to Asians by Single Mother Poverty
In terms of single mother poverty, the demographic groups most similar to Asians are Bolivian (25.9%, a difference of 0.18%), Immigrants from Pakistan (26.0%, a difference of 0.28%), Immigrants from Eastern Asia (26.1%, a difference of 0.43%), Immigrants from Ireland (25.8%, a difference of 0.47%), and Immigrants from China (26.1%, a difference of 0.55%).
| Demographics | Rating | Rank | Single Mother Poverty |
| Immigrants | South Central Asia | 100.0 /100 | #10 | Exceptional 25.3% |
| Iranians | 100.0 /100 | #11 | Exceptional 25.5% |
| Bhutanese | 100.0 /100 | #12 | Exceptional 25.6% |
| Indians (Asian) | 100.0 /100 | #13 | Exceptional 25.8% |
| Immigrants | Singapore | 100.0 /100 | #14 | Exceptional 25.8% |
| Immigrants | Ireland | 100.0 /100 | #15 | Exceptional 25.8% |
| Bolivians | 100.0 /100 | #16 | Exceptional 25.9% |
| Asians | 100.0 /100 | #17 | Exceptional 26.0% |
| Immigrants | Pakistan | 100.0 /100 | #18 | Exceptional 26.0% |
| Immigrants | Eastern Asia | 100.0 /100 | #19 | Exceptional 26.1% |
| Immigrants | China | 100.0 /100 | #20 | Exceptional 26.1% |
| Immigrants | Bolivia | 100.0 /100 | #21 | Exceptional 26.2% |
| Immigrants | Korea | 100.0 /100 | #22 | Exceptional 26.2% |
| Burmese | 100.0 /100 | #23 | Exceptional 26.2% |
| Immigrants | Moldova | 100.0 /100 | #24 | Exceptional 26.2% |