Trinidadian and Tobagonian vs Asian Single Mother Poverty
COMPARE
Trinidadian and Tobagonian
Asian
Single Mother Poverty
Single Mother Poverty Comparison
Trinidadians and Tobagonians
Asians
29.6%
SINGLE MOTHER POVERTY
21.7/ 100
METRIC RATING
198th/ 347
METRIC RANK
26.0%
SINGLE MOTHER POVERTY
100.0/ 100
METRIC RATING
17th/ 347
METRIC RANK
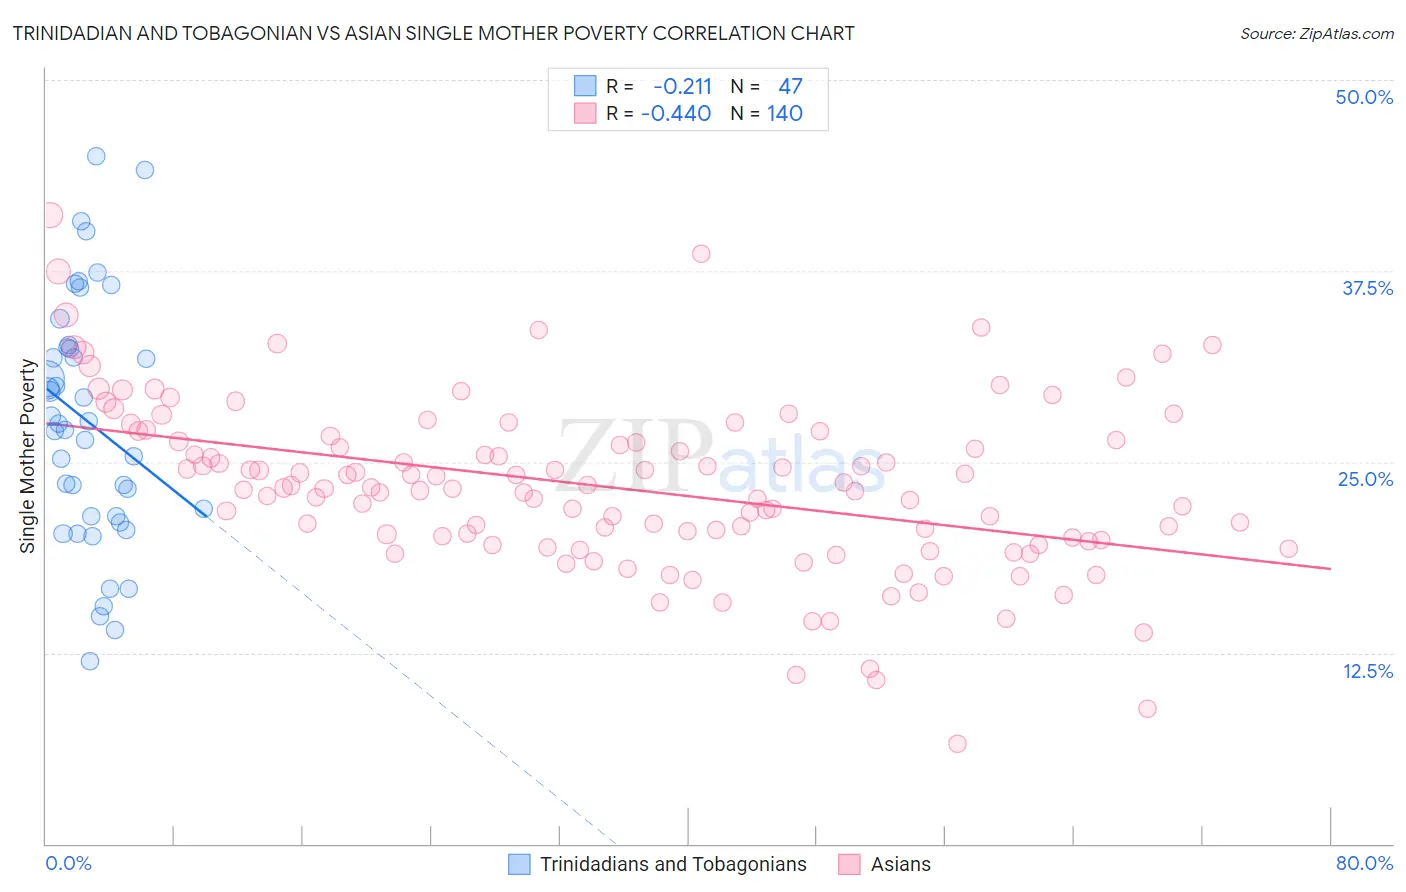
Trinidadian and Tobagonian vs Asian Single Mother Poverty Correlation Chart
The statistical analysis conducted on geographies consisting of 216,680,407 people shows a weak negative correlation between the proportion of Trinidadians and Tobagonians and poverty level among single mothers in the United States with a correlation coefficient (R) of -0.211 and weighted average of 29.6%. Similarly, the statistical analysis conducted on geographies consisting of 527,260,509 people shows a moderate negative correlation between the proportion of Asians and poverty level among single mothers in the United States with a correlation coefficient (R) of -0.440 and weighted average of 26.0%, a difference of 14.1%.
Single Mother Poverty Correlation Summary
| Measurement | Trinidadian and Tobagonian | Asian |
| Minimum | 12.0% | 6.6% |
| Maximum | 45.0% | 41.1% |
| Range | 33.0% | 34.6% |
| Mean | 27.6% | 23.3% |
| Median | 27.5% | 23.3% |
| Interquartile 25% (IQ1) | 21.4% | 19.9% |
| Interquartile 75% (IQ3) | 32.5% | 26.4% |
| Interquartile Range (IQR) | 11.1% | 6.5% |
| Standard Deviation (Sample) | 8.0% | 5.6% |
| Standard Deviation (Population) | 7.9% | 5.6% |
Similar Demographics by Single Mother Poverty
Demographics Similar to Trinidadians and Tobagonians by Single Mother Poverty
In terms of single mother poverty, the demographic groups most similar to Trinidadians and Tobagonians are Immigrants from Jamaica (29.6%, a difference of 0.020%), Cuban (29.6%, a difference of 0.070%), Spanish American Indian (29.6%, a difference of 0.11%), Panamanian (29.6%, a difference of 0.12%), and Slavic (29.6%, a difference of 0.18%).
| Demographics | Rating | Rank | Single Mother Poverty |
| Immigrants | Trinidad and Tobago | 29.2 /100 | #191 | Fair 29.5% |
| Moroccans | 28.6 /100 | #192 | Fair 29.5% |
| Basques | 28.3 /100 | #193 | Fair 29.5% |
| Icelanders | 26.1 /100 | #194 | Fair 29.5% |
| Slavs | 24.5 /100 | #195 | Fair 29.6% |
| Spanish American Indians | 23.4 /100 | #196 | Fair 29.6% |
| Immigrants | Jamaica | 22.0 /100 | #197 | Fair 29.6% |
| Trinidadians and Tobagonians | 21.7 /100 | #198 | Fair 29.6% |
| Cubans | 20.8 /100 | #199 | Fair 29.6% |
| Panamanians | 20.0 /100 | #200 | Fair 29.6% |
| Belgians | 18.8 /100 | #201 | Poor 29.7% |
| Malaysians | 17.4 /100 | #202 | Poor 29.7% |
| Swiss | 17.2 /100 | #203 | Poor 29.7% |
| Immigrants | Immigrants | 16.6 /100 | #204 | Poor 29.7% |
| Czechoslovakians | 16.1 /100 | #205 | Poor 29.7% |
Demographics Similar to Asians by Single Mother Poverty
In terms of single mother poverty, the demographic groups most similar to Asians are Bolivian (25.9%, a difference of 0.18%), Immigrants from Pakistan (26.0%, a difference of 0.28%), Immigrants from Eastern Asia (26.1%, a difference of 0.43%), Immigrants from Ireland (25.8%, a difference of 0.47%), and Immigrants from China (26.1%, a difference of 0.55%).
| Demographics | Rating | Rank | Single Mother Poverty |
| Immigrants | South Central Asia | 100.0 /100 | #10 | Exceptional 25.3% |
| Iranians | 100.0 /100 | #11 | Exceptional 25.5% |
| Bhutanese | 100.0 /100 | #12 | Exceptional 25.6% |
| Indians (Asian) | 100.0 /100 | #13 | Exceptional 25.8% |
| Immigrants | Singapore | 100.0 /100 | #14 | Exceptional 25.8% |
| Immigrants | Ireland | 100.0 /100 | #15 | Exceptional 25.8% |
| Bolivians | 100.0 /100 | #16 | Exceptional 25.9% |
| Asians | 100.0 /100 | #17 | Exceptional 26.0% |
| Immigrants | Pakistan | 100.0 /100 | #18 | Exceptional 26.0% |
| Immigrants | Eastern Asia | 100.0 /100 | #19 | Exceptional 26.1% |
| Immigrants | China | 100.0 /100 | #20 | Exceptional 26.1% |
| Immigrants | Bolivia | 100.0 /100 | #21 | Exceptional 26.2% |
| Immigrants | Korea | 100.0 /100 | #22 | Exceptional 26.2% |
| Burmese | 100.0 /100 | #23 | Exceptional 26.2% |
| Immigrants | Moldova | 100.0 /100 | #24 | Exceptional 26.2% |