Immigrants from India vs Asian Single Mother Poverty
COMPARE
Immigrants from India
Asian
Single Mother Poverty
Single Mother Poverty Comparison
Immigrants from India
Asians
23.8%
SINGLE MOTHER POVERTY
100.0/ 100
METRIC RATING
2nd/ 347
METRIC RANK
26.0%
SINGLE MOTHER POVERTY
100.0/ 100
METRIC RATING
17th/ 347
METRIC RANK
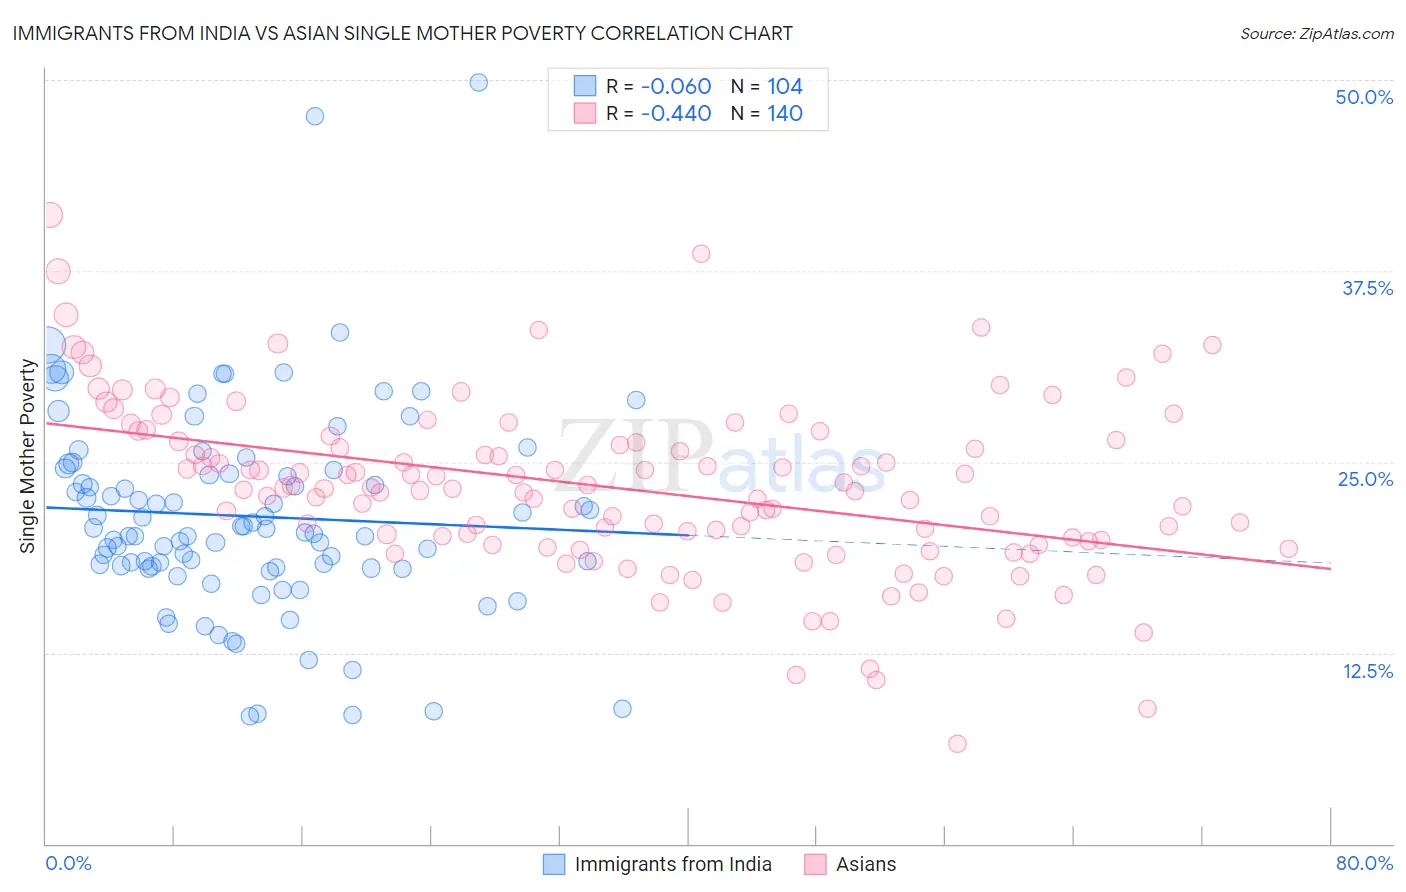
Immigrants from India vs Asian Single Mother Poverty Correlation Chart
The statistical analysis conducted on geographies consisting of 420,975,402 people shows a slight negative correlation between the proportion of Immigrants from India and poverty level among single mothers in the United States with a correlation coefficient (R) of -0.060 and weighted average of 23.8%. Similarly, the statistical analysis conducted on geographies consisting of 527,260,509 people shows a moderate negative correlation between the proportion of Asians and poverty level among single mothers in the United States with a correlation coefficient (R) of -0.440 and weighted average of 26.0%, a difference of 9.0%.
Single Mother Poverty Correlation Summary
| Measurement | Immigrants from India | Asian |
| Minimum | 8.3% | 6.6% |
| Maximum | 49.8% | 41.1% |
| Range | 41.5% | 34.6% |
| Mean | 21.4% | 23.3% |
| Median | 20.5% | 23.3% |
| Interquartile 25% (IQ1) | 18.1% | 19.9% |
| Interquartile 75% (IQ3) | 24.3% | 26.4% |
| Interquartile Range (IQR) | 6.2% | 6.5% |
| Standard Deviation (Sample) | 6.7% | 5.6% |
| Standard Deviation (Population) | 6.7% | 5.6% |
Demographics Similar to Immigrants from India and Asians by Single Mother Poverty
In terms of single mother poverty, the demographic groups most similar to Immigrants from India are Assyrian/Chaldean/Syriac (23.8%, a difference of 0.020%), Immigrants from Taiwan (23.9%, a difference of 0.20%), Filipino (24.3%, a difference of 2.1%), Immigrants from Hong Kong (24.4%, a difference of 2.4%), and Thai (24.5%, a difference of 2.9%). Similarly, the demographic groups most similar to Asians are Bolivian (25.9%, a difference of 0.18%), Immigrants from Pakistan (26.0%, a difference of 0.28%), Immigrants from Eastern Asia (26.1%, a difference of 0.43%), Immigrants from Ireland (25.8%, a difference of 0.47%), and Immigrants from China (26.1%, a difference of 0.55%).
| Demographics | Rating | Rank | Single Mother Poverty |
| Assyrians/Chaldeans/Syriacs | 100.0 /100 | #1 | Exceptional 23.8% |
| Immigrants | India | 100.0 /100 | #2 | Exceptional 23.8% |
| Immigrants | Taiwan | 100.0 /100 | #3 | Exceptional 23.9% |
| Filipinos | 100.0 /100 | #4 | Exceptional 24.3% |
| Immigrants | Hong Kong | 100.0 /100 | #5 | Exceptional 24.4% |
| Thais | 100.0 /100 | #6 | Exceptional 24.5% |
| Chinese | 100.0 /100 | #7 | Exceptional 24.6% |
| Immigrants | Iran | 100.0 /100 | #8 | Exceptional 25.1% |
| Immigrants | Lithuania | 100.0 /100 | #9 | Exceptional 25.2% |
| Immigrants | South Central Asia | 100.0 /100 | #10 | Exceptional 25.3% |
| Iranians | 100.0 /100 | #11 | Exceptional 25.5% |
| Bhutanese | 100.0 /100 | #12 | Exceptional 25.6% |
| Indians (Asian) | 100.0 /100 | #13 | Exceptional 25.8% |
| Immigrants | Singapore | 100.0 /100 | #14 | Exceptional 25.8% |
| Immigrants | Ireland | 100.0 /100 | #15 | Exceptional 25.8% |
| Bolivians | 100.0 /100 | #16 | Exceptional 25.9% |
| Asians | 100.0 /100 | #17 | Exceptional 26.0% |
| Immigrants | Pakistan | 100.0 /100 | #18 | Exceptional 26.0% |
| Immigrants | Eastern Asia | 100.0 /100 | #19 | Exceptional 26.1% |
| Immigrants | China | 100.0 /100 | #20 | Exceptional 26.1% |