Sierra Leonean vs Asian Single Mother Poverty
COMPARE
Sierra Leonean
Asian
Single Mother Poverty
Single Mother Poverty Comparison
Sierra Leoneans
Asians
27.4%
SINGLE MOTHER POVERTY
99.3/ 100
METRIC RATING
73rd/ 347
METRIC RANK
26.0%
SINGLE MOTHER POVERTY
100.0/ 100
METRIC RATING
17th/ 347
METRIC RANK
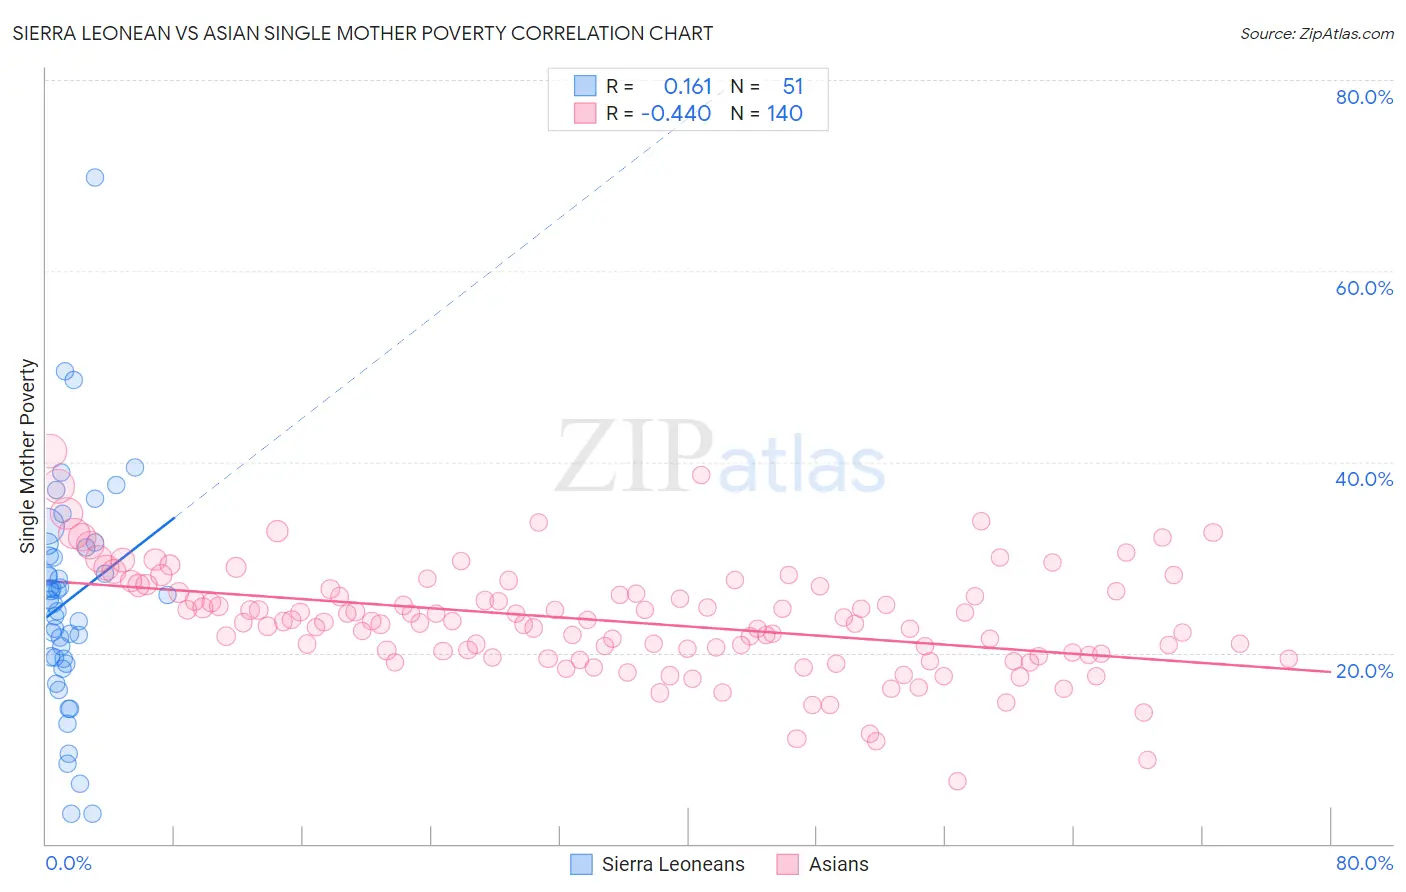
Sierra Leonean vs Asian Single Mother Poverty Correlation Chart
The statistical analysis conducted on geographies consisting of 83,072,166 people shows a poor positive correlation between the proportion of Sierra Leoneans and poverty level among single mothers in the United States with a correlation coefficient (R) of 0.161 and weighted average of 27.4%. Similarly, the statistical analysis conducted on geographies consisting of 527,260,509 people shows a moderate negative correlation between the proportion of Asians and poverty level among single mothers in the United States with a correlation coefficient (R) of -0.440 and weighted average of 26.0%, a difference of 5.7%.
Single Mother Poverty Correlation Summary
| Measurement | Sierra Leonean | Asian |
| Minimum | 3.1% | 6.6% |
| Maximum | 69.8% | 41.1% |
| Range | 66.7% | 34.6% |
| Mean | 25.5% | 23.3% |
| Median | 25.6% | 23.3% |
| Interquartile 25% (IQ1) | 19.4% | 19.9% |
| Interquartile 75% (IQ3) | 31.0% | 26.4% |
| Interquartile Range (IQR) | 11.6% | 6.5% |
| Standard Deviation (Sample) | 11.8% | 5.6% |
| Standard Deviation (Population) | 11.7% | 5.6% |
Similar Demographics by Single Mother Poverty
Demographics Similar to Sierra Leoneans by Single Mother Poverty
In terms of single mother poverty, the demographic groups most similar to Sierra Leoneans are Immigrants from Russia (27.4%, a difference of 0.060%), Immigrants from Europe (27.4%, a difference of 0.060%), Macedonian (27.4%, a difference of 0.090%), Immigrants from Belarus (27.4%, a difference of 0.11%), and Lithuanian (27.4%, a difference of 0.12%).
| Demographics | Rating | Rank | Single Mother Poverty |
| Soviet Union | 99.5 /100 | #66 | Exceptional 27.3% |
| Immigrants | Australia | 99.5 /100 | #67 | Exceptional 27.3% |
| Immigrants | Czechoslovakia | 99.5 /100 | #68 | Exceptional 27.4% |
| Lithuanians | 99.4 /100 | #69 | Exceptional 27.4% |
| Immigrants | Belarus | 99.4 /100 | #70 | Exceptional 27.4% |
| Macedonians | 99.4 /100 | #71 | Exceptional 27.4% |
| Immigrants | Russia | 99.4 /100 | #72 | Exceptional 27.4% |
| Sierra Leoneans | 99.3 /100 | #73 | Exceptional 27.4% |
| Immigrants | Europe | 99.3 /100 | #74 | Exceptional 27.4% |
| Immigrants | Sweden | 99.2 /100 | #75 | Exceptional 27.5% |
| Peruvians | 99.2 /100 | #76 | Exceptional 27.5% |
| Immigrants | Peru | 99.2 /100 | #77 | Exceptional 27.5% |
| Immigrants | North Macedonia | 99.2 /100 | #78 | Exceptional 27.5% |
| Immigrants | Italy | 99.1 /100 | #79 | Exceptional 27.5% |
| Taiwanese | 99.1 /100 | #80 | Exceptional 27.5% |
Demographics Similar to Asians by Single Mother Poverty
In terms of single mother poverty, the demographic groups most similar to Asians are Bolivian (25.9%, a difference of 0.18%), Immigrants from Pakistan (26.0%, a difference of 0.28%), Immigrants from Eastern Asia (26.1%, a difference of 0.43%), Immigrants from Ireland (25.8%, a difference of 0.47%), and Immigrants from China (26.1%, a difference of 0.55%).
| Demographics | Rating | Rank | Single Mother Poverty |
| Immigrants | South Central Asia | 100.0 /100 | #10 | Exceptional 25.3% |
| Iranians | 100.0 /100 | #11 | Exceptional 25.5% |
| Bhutanese | 100.0 /100 | #12 | Exceptional 25.6% |
| Indians (Asian) | 100.0 /100 | #13 | Exceptional 25.8% |
| Immigrants | Singapore | 100.0 /100 | #14 | Exceptional 25.8% |
| Immigrants | Ireland | 100.0 /100 | #15 | Exceptional 25.8% |
| Bolivians | 100.0 /100 | #16 | Exceptional 25.9% |
| Asians | 100.0 /100 | #17 | Exceptional 26.0% |
| Immigrants | Pakistan | 100.0 /100 | #18 | Exceptional 26.0% |
| Immigrants | Eastern Asia | 100.0 /100 | #19 | Exceptional 26.1% |
| Immigrants | China | 100.0 /100 | #20 | Exceptional 26.1% |
| Immigrants | Bolivia | 100.0 /100 | #21 | Exceptional 26.2% |
| Immigrants | Korea | 100.0 /100 | #22 | Exceptional 26.2% |
| Burmese | 100.0 /100 | #23 | Exceptional 26.2% |
| Immigrants | Moldova | 100.0 /100 | #24 | Exceptional 26.2% |