Immigrants from Western Asia vs Asian Single Mother Poverty
COMPARE
Immigrants from Western Asia
Asian
Single Mother Poverty
Single Mother Poverty Comparison
Immigrants from Western Asia
Asians
28.3%
SINGLE MOTHER POVERTY
92.7/ 100
METRIC RATING
114th/ 347
METRIC RANK
26.0%
SINGLE MOTHER POVERTY
100.0/ 100
METRIC RATING
17th/ 347
METRIC RANK
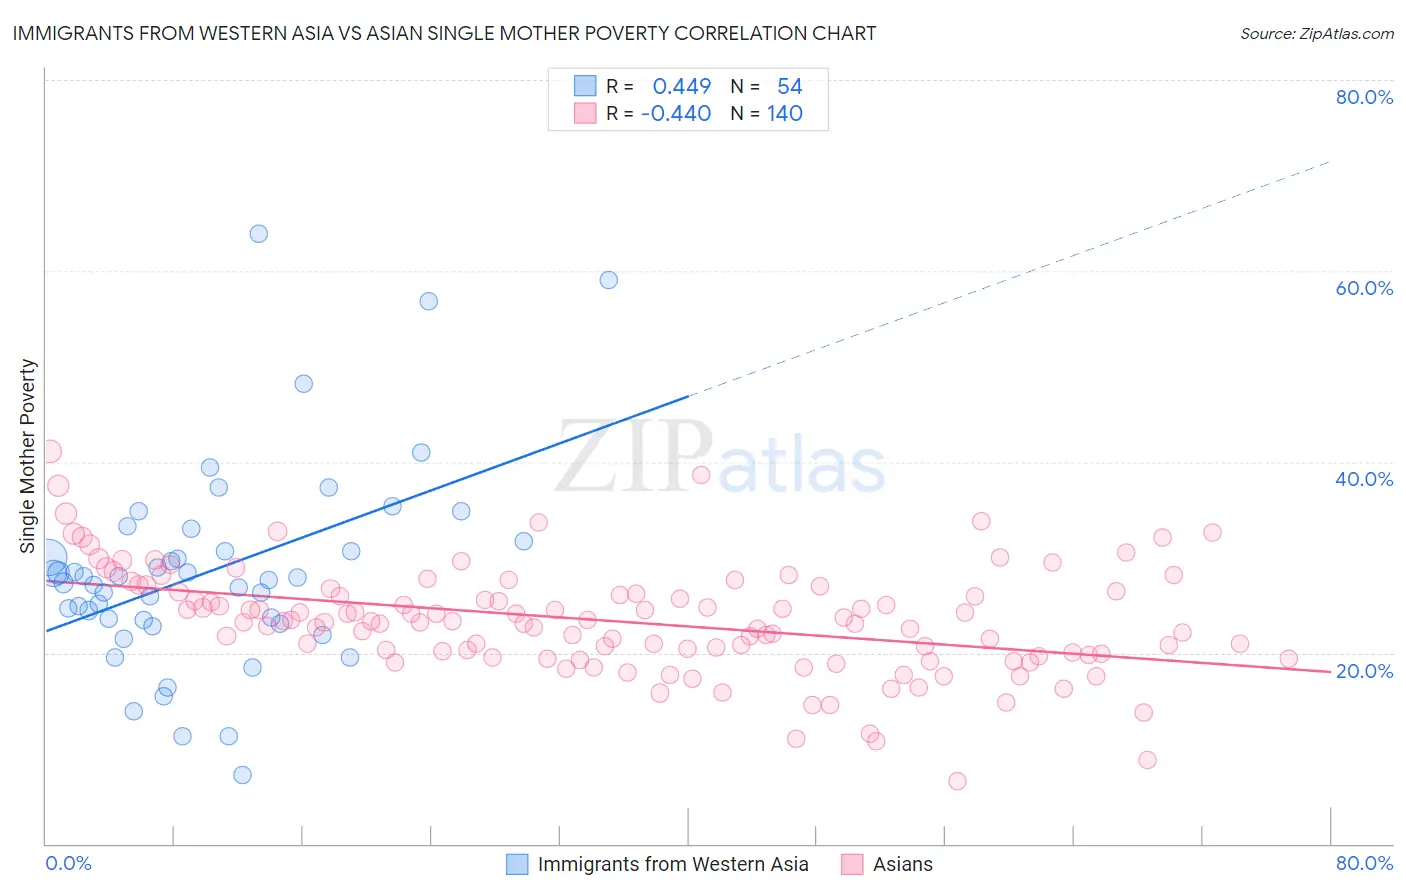
Immigrants from Western Asia vs Asian Single Mother Poverty Correlation Chart
The statistical analysis conducted on geographies consisting of 393,114,068 people shows a moderate positive correlation between the proportion of Immigrants from Western Asia and poverty level among single mothers in the United States with a correlation coefficient (R) of 0.449 and weighted average of 28.3%. Similarly, the statistical analysis conducted on geographies consisting of 527,260,509 people shows a moderate negative correlation between the proportion of Asians and poverty level among single mothers in the United States with a correlation coefficient (R) of -0.440 and weighted average of 26.0%, a difference of 8.9%.
Single Mother Poverty Correlation Summary
| Measurement | Immigrants from Western Asia | Asian |
| Minimum | 7.2% | 6.6% |
| Maximum | 63.9% | 41.1% |
| Range | 56.7% | 34.6% |
| Mean | 28.6% | 23.3% |
| Median | 27.8% | 23.3% |
| Interquartile 25% (IQ1) | 23.4% | 19.9% |
| Interquartile 75% (IQ3) | 31.6% | 26.4% |
| Interquartile Range (IQR) | 8.2% | 6.5% |
| Standard Deviation (Sample) | 10.8% | 5.6% |
| Standard Deviation (Population) | 10.7% | 5.6% |
Similar Demographics by Single Mother Poverty
Demographics Similar to Immigrants from Western Asia by Single Mother Poverty
In terms of single mother poverty, the demographic groups most similar to Immigrants from Western Asia are Immigrants from Kuwait (28.3%, a difference of 0.010%), Immigrants from Uganda (28.3%, a difference of 0.030%), Australian (28.3%, a difference of 0.040%), Brazilian (28.3%, a difference of 0.050%), and Immigrants from Syria (28.3%, a difference of 0.060%).
| Demographics | Rating | Rank | Single Mother Poverty |
| Immigrants | Venezuela | 95.8 /100 | #107 | Exceptional 28.1% |
| Immigrants | Zimbabwe | 95.5 /100 | #108 | Exceptional 28.1% |
| Immigrants | Armenia | 95.2 /100 | #109 | Exceptional 28.1% |
| Croatians | 94.8 /100 | #110 | Exceptional 28.2% |
| Venezuelans | 94.5 /100 | #111 | Exceptional 28.2% |
| Immigrants | Kazakhstan | 94.5 /100 | #112 | Exceptional 28.2% |
| Immigrants | South Africa | 93.2 /100 | #113 | Exceptional 28.3% |
| Immigrants | Western Asia | 92.7 /100 | #114 | Exceptional 28.3% |
| Immigrants | Kuwait | 92.7 /100 | #115 | Exceptional 28.3% |
| Immigrants | Uganda | 92.5 /100 | #116 | Exceptional 28.3% |
| Australians | 92.5 /100 | #117 | Exceptional 28.3% |
| Brazilians | 92.4 /100 | #118 | Exceptional 28.3% |
| Immigrants | Syria | 92.4 /100 | #119 | Exceptional 28.3% |
| Cypriots | 92.3 /100 | #120 | Exceptional 28.3% |
| Immigrants | Afghanistan | 92.1 /100 | #121 | Exceptional 28.3% |
Demographics Similar to Asians by Single Mother Poverty
In terms of single mother poverty, the demographic groups most similar to Asians are Bolivian (25.9%, a difference of 0.18%), Immigrants from Pakistan (26.0%, a difference of 0.28%), Immigrants from Eastern Asia (26.1%, a difference of 0.43%), Immigrants from Ireland (25.8%, a difference of 0.47%), and Immigrants from China (26.1%, a difference of 0.55%).
| Demographics | Rating | Rank | Single Mother Poverty |
| Immigrants | South Central Asia | 100.0 /100 | #10 | Exceptional 25.3% |
| Iranians | 100.0 /100 | #11 | Exceptional 25.5% |
| Bhutanese | 100.0 /100 | #12 | Exceptional 25.6% |
| Indians (Asian) | 100.0 /100 | #13 | Exceptional 25.8% |
| Immigrants | Singapore | 100.0 /100 | #14 | Exceptional 25.8% |
| Immigrants | Ireland | 100.0 /100 | #15 | Exceptional 25.8% |
| Bolivians | 100.0 /100 | #16 | Exceptional 25.9% |
| Asians | 100.0 /100 | #17 | Exceptional 26.0% |
| Immigrants | Pakistan | 100.0 /100 | #18 | Exceptional 26.0% |
| Immigrants | Eastern Asia | 100.0 /100 | #19 | Exceptional 26.1% |
| Immigrants | China | 100.0 /100 | #20 | Exceptional 26.1% |
| Immigrants | Bolivia | 100.0 /100 | #21 | Exceptional 26.2% |
| Immigrants | Korea | 100.0 /100 | #22 | Exceptional 26.2% |
| Burmese | 100.0 /100 | #23 | Exceptional 26.2% |
| Immigrants | Moldova | 100.0 /100 | #24 | Exceptional 26.2% |