Alaska Native vs Asian Unemployment Among Ages 65 to 74 years
COMPARE
Alaska Native
Asian
Unemployment Among Ages 65 to 74 years
Unemployment Among Ages 65 to 74 years Comparison
Alaska Natives
Asians
6.8%
UNEMPLOYMENT AMONG AGES 65 TO 74 YEARS
0.0/ 100
METRIC RATING
341st/ 347
METRIC RANK
5.3%
UNEMPLOYMENT AMONG AGES 65 TO 74 YEARS
91.1/ 100
METRIC RATING
114th/ 347
METRIC RANK
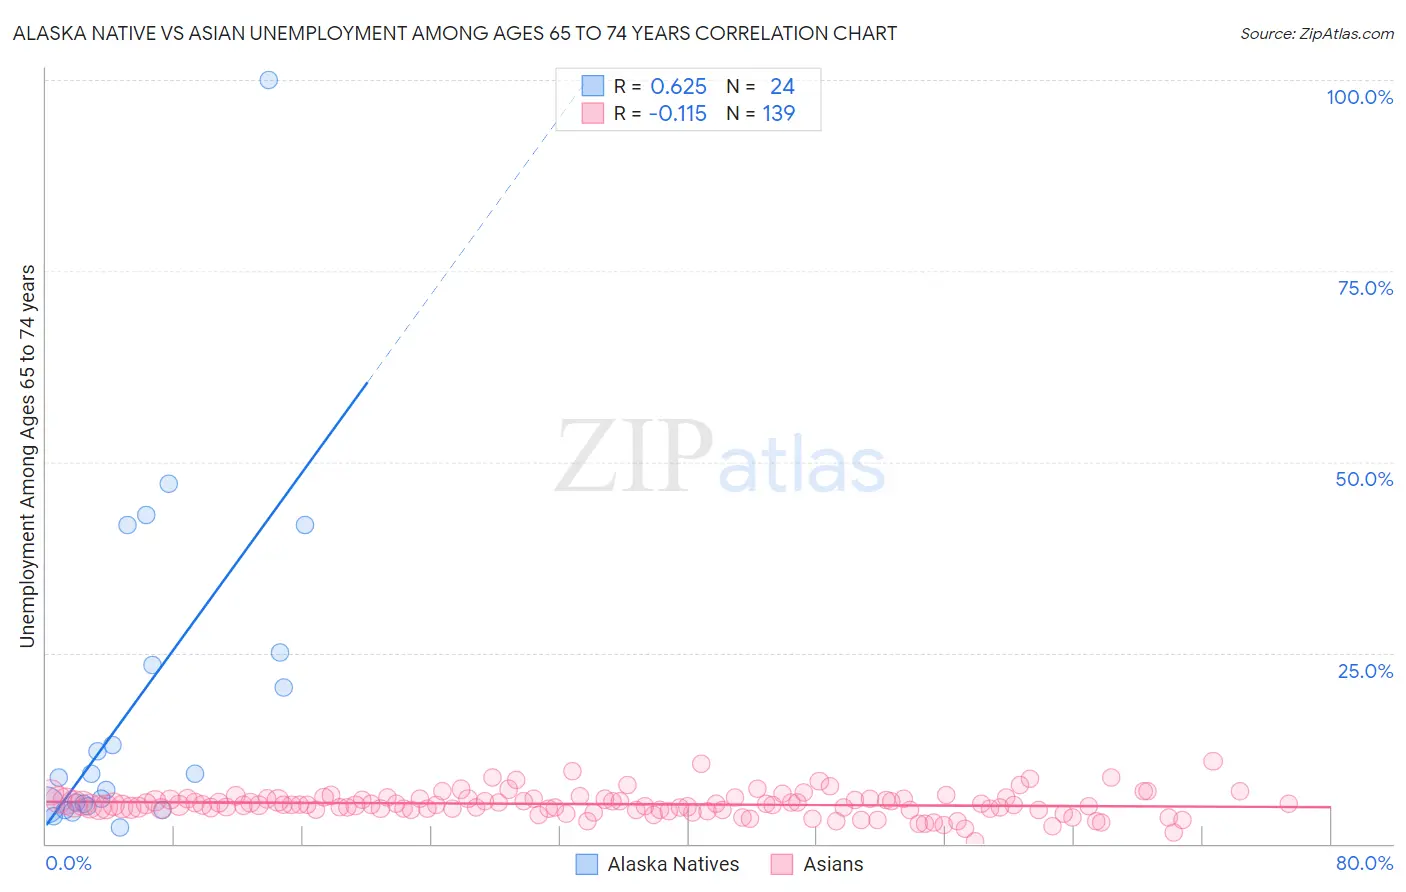
Alaska Native vs Asian Unemployment Among Ages 65 to 74 years Correlation Chart
The statistical analysis conducted on geographies consisting of 72,668,182 people shows a significant positive correlation between the proportion of Alaska Natives and unemployment rate among population between the ages 65 and 74 in the United States with a correlation coefficient (R) of 0.625 and weighted average of 6.8%. Similarly, the statistical analysis conducted on geographies consisting of 441,679,569 people shows a poor negative correlation between the proportion of Asians and unemployment rate among population between the ages 65 and 74 in the United States with a correlation coefficient (R) of -0.115 and weighted average of 5.3%, a difference of 29.7%.
Unemployment Among Ages 65 to 74 years Correlation Summary
| Measurement | Alaska Native | Asian |
| Minimum | 2.2% | 0.40% |
| Maximum | 100.0% | 10.8% |
| Range | 97.8% | 10.4% |
| Mean | 18.6% | 5.2% |
| Median | 8.9% | 5.1% |
| Interquartile 25% (IQ1) | 5.0% | 4.5% |
| Interquartile 75% (IQ3) | 24.2% | 5.9% |
| Interquartile Range (IQR) | 19.2% | 1.4% |
| Standard Deviation (Sample) | 22.5% | 1.6% |
| Standard Deviation (Population) | 22.0% | 1.6% |
Similar Demographics by Unemployment Among Ages 65 to 74 years
Demographics Similar to Alaska Natives by Unemployment Among Ages 65 to 74 years
In terms of unemployment among ages 65 to 74 years, the demographic groups most similar to Alaska Natives are Navajo (6.9%, a difference of 1.5%), Pima (6.6%, a difference of 3.2%), Yakama (6.6%, a difference of 4.1%), Tlingit-Haida (6.5%, a difference of 4.5%), and Ute (6.5%, a difference of 4.6%).
| Demographics | Rating | Rank | Unemployment Among Ages 65 to 74 years |
| Paiute | 0.0 /100 | #333 | Tragic 6.3% |
| Taiwanese | 0.0 /100 | #334 | Tragic 6.3% |
| Puerto Ricans | 0.0 /100 | #335 | Tragic 6.4% |
| Immigrants | Armenia | 0.0 /100 | #336 | Tragic 6.5% |
| Ute | 0.0 /100 | #337 | Tragic 6.5% |
| Tlingit-Haida | 0.0 /100 | #338 | Tragic 6.5% |
| Yakama | 0.0 /100 | #339 | Tragic 6.6% |
| Pima | 0.0 /100 | #340 | Tragic 6.6% |
| Alaska Natives | 0.0 /100 | #341 | Tragic 6.8% |
| Navajo | 0.0 /100 | #342 | Tragic 6.9% |
| Alaskan Athabascans | 0.0 /100 | #343 | Tragic 7.4% |
| Inupiat | 0.0 /100 | #344 | Tragic 7.5% |
| Immigrants | Yemen | 0.0 /100 | #345 | Tragic 8.3% |
| Yup'ik | 0.0 /100 | #346 | Tragic 9.5% |
| Crow | 0.0 /100 | #347 | Tragic 17.4% |
Demographics Similar to Asians by Unemployment Among Ages 65 to 74 years
In terms of unemployment among ages 65 to 74 years, the demographic groups most similar to Asians are Immigrants from Turkey (5.3%, a difference of 0.020%), Immigrants from Germany (5.3%, a difference of 0.050%), Australian (5.3%, a difference of 0.060%), Immigrants from Korea (5.3%, a difference of 0.090%), and Immigrants from Belarus (5.3%, a difference of 0.10%).
| Demographics | Rating | Rank | Unemployment Among Ages 65 to 74 years |
| Austrians | 94.5 /100 | #107 | Exceptional 5.2% |
| Immigrants | Malaysia | 94.1 /100 | #108 | Exceptional 5.2% |
| Immigrants | Singapore | 93.9 /100 | #109 | Exceptional 5.2% |
| Immigrants | Bolivia | 93.6 /100 | #110 | Exceptional 5.2% |
| Sri Lankans | 92.7 /100 | #111 | Exceptional 5.3% |
| Immigrants | South Central Asia | 92.4 /100 | #112 | Exceptional 5.3% |
| Immigrants | Germany | 91.6 /100 | #113 | Exceptional 5.3% |
| Asians | 91.1 /100 | #114 | Exceptional 5.3% |
| Immigrants | Turkey | 90.8 /100 | #115 | Exceptional 5.3% |
| Australians | 90.4 /100 | #116 | Exceptional 5.3% |
| Immigrants | Korea | 90.2 /100 | #117 | Exceptional 5.3% |
| Immigrants | Belarus | 90.1 /100 | #118 | Exceptional 5.3% |
| Immigrants | Fiji | 89.9 /100 | #119 | Excellent 5.3% |
| Immigrants | Switzerland | 89.9 /100 | #120 | Excellent 5.3% |
| Immigrants | Australia | 89.1 /100 | #121 | Excellent 5.3% |