Belgian vs Puget Sound Salish Single Mother Poverty
COMPARE
Belgian
Puget Sound Salish
Single Mother Poverty
Single Mother Poverty Comparison
Belgians
Puget Sound Salish
29.7%
SINGLE MOTHER POVERTY
18.8/ 100
METRIC RATING
201st/ 347
METRIC RANK
29.1%
SINGLE MOTHER POVERTY
55.1/ 100
METRIC RATING
171st/ 347
METRIC RANK
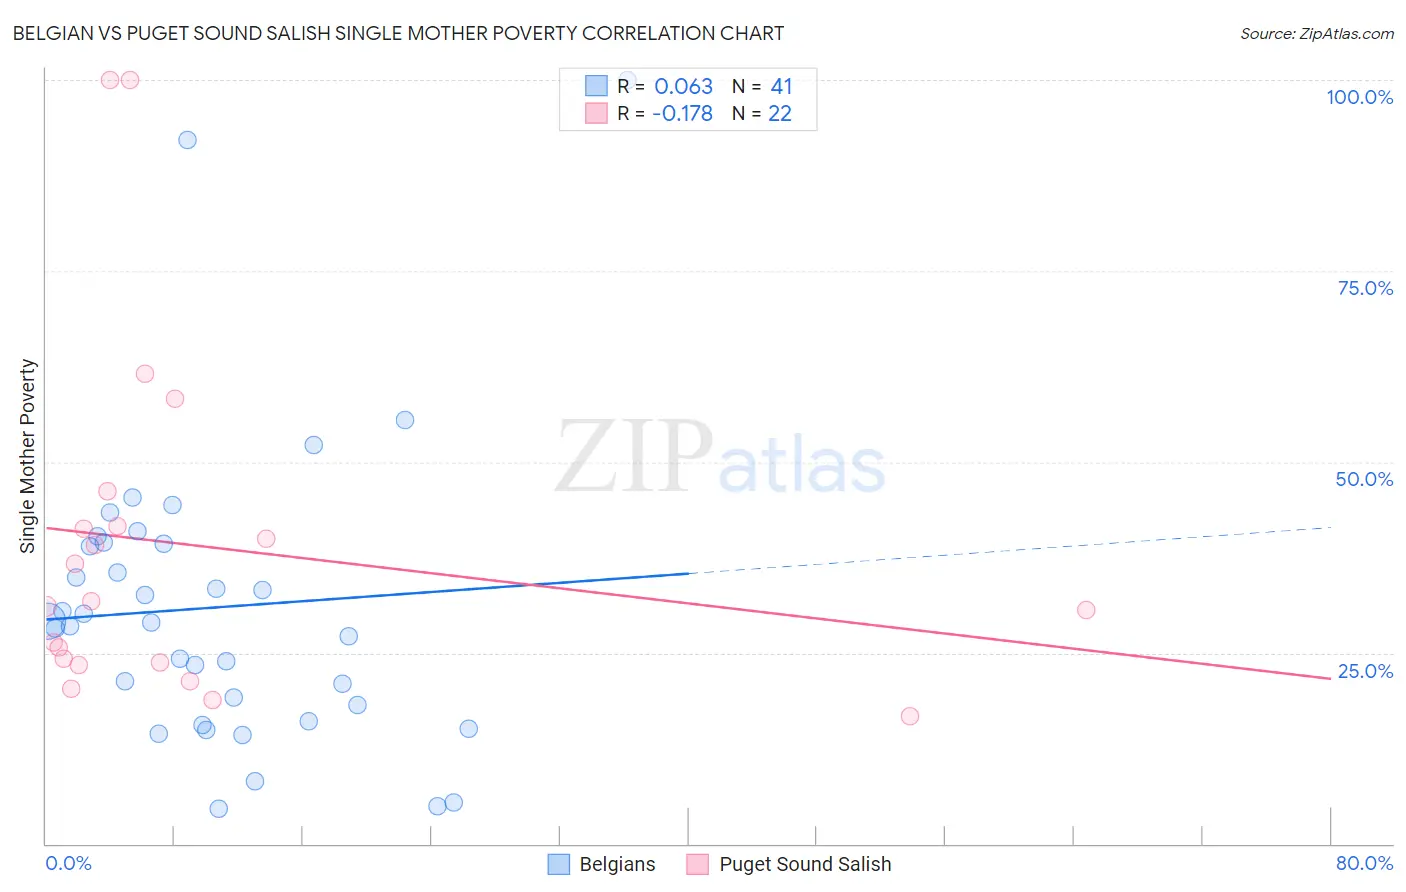
Belgian vs Puget Sound Salish Single Mother Poverty Correlation Chart
The statistical analysis conducted on geographies consisting of 346,546,144 people shows a slight positive correlation between the proportion of Belgians and poverty level among single mothers in the United States with a correlation coefficient (R) of 0.063 and weighted average of 29.7%. Similarly, the statistical analysis conducted on geographies consisting of 45,775,408 people shows a poor negative correlation between the proportion of Puget Sound Salish and poverty level among single mothers in the United States with a correlation coefficient (R) of -0.178 and weighted average of 29.1%, a difference of 2.0%.
Single Mother Poverty Correlation Summary
| Measurement | Belgian | Puget Sound Salish |
| Minimum | 4.5% | 16.7% |
| Maximum | 100.0% | 100.0% |
| Range | 95.5% | 83.3% |
| Mean | 30.9% | 39.0% |
| Median | 29.0% | 31.4% |
| Interquartile 25% (IQ1) | 17.1% | 23.7% |
| Interquartile 75% (IQ3) | 39.4% | 41.6% |
| Interquartile Range (IQR) | 22.2% | 17.9% |
| Standard Deviation (Sample) | 19.6% | 23.1% |
| Standard Deviation (Population) | 19.3% | 22.5% |
Similar Demographics by Single Mother Poverty
Demographics Similar to Belgians by Single Mother Poverty
In terms of single mother poverty, the demographic groups most similar to Belgians are Panamanian (29.6%, a difference of 0.10%), Malaysian (29.7%, a difference of 0.10%), Swiss (29.7%, a difference of 0.12%), Cuban (29.6%, a difference of 0.15%), and Immigrants (29.7%, a difference of 0.18%).
| Demographics | Rating | Rank | Single Mother Poverty |
| Icelanders | 26.1 /100 | #194 | Fair 29.5% |
| Slavs | 24.5 /100 | #195 | Fair 29.6% |
| Spanish American Indians | 23.4 /100 | #196 | Fair 29.6% |
| Immigrants | Jamaica | 22.0 /100 | #197 | Fair 29.6% |
| Trinidadians and Tobagonians | 21.7 /100 | #198 | Fair 29.6% |
| Cubans | 20.8 /100 | #199 | Fair 29.6% |
| Panamanians | 20.0 /100 | #200 | Fair 29.6% |
| Belgians | 18.8 /100 | #201 | Poor 29.7% |
| Malaysians | 17.4 /100 | #202 | Poor 29.7% |
| Swiss | 17.2 /100 | #203 | Poor 29.7% |
| Immigrants | Immigrants | 16.6 /100 | #204 | Poor 29.7% |
| Czechoslovakians | 16.1 /100 | #205 | Poor 29.7% |
| Immigrants | Haiti | 15.8 /100 | #206 | Poor 29.7% |
| Immigrants | Panama | 15.5 /100 | #207 | Poor 29.8% |
| Immigrants | Guyana | 14.7 /100 | #208 | Poor 29.8% |
Demographics Similar to Puget Sound Salish by Single Mother Poverty
In terms of single mother poverty, the demographic groups most similar to Puget Sound Salish are New Zealander (29.1%, a difference of 0.0%), Carpatho Rusyn (29.1%, a difference of 0.060%), Immigrants from Uruguay (29.1%, a difference of 0.11%), European (29.1%, a difference of 0.12%), and Costa Rican (29.0%, a difference of 0.16%).
| Demographics | Rating | Rank | Single Mother Poverty |
| Immigrants | Kenya | 65.9 /100 | #164 | Good 28.9% |
| Arabs | 60.7 /100 | #165 | Good 29.0% |
| Inupiat | 60.4 /100 | #166 | Good 29.0% |
| Costa Ricans | 58.4 /100 | #167 | Average 29.0% |
| Europeans | 57.6 /100 | #168 | Average 29.1% |
| Immigrants | Uruguay | 57.2 /100 | #169 | Average 29.1% |
| New Zealanders | 55.1 /100 | #170 | Average 29.1% |
| Puget Sound Salish | 55.1 /100 | #171 | Average 29.1% |
| Carpatho Rusyns | 53.8 /100 | #172 | Average 29.1% |
| British | 50.6 /100 | #173 | Average 29.2% |
| Immigrants | Saudi Arabia | 50.0 /100 | #174 | Average 29.2% |
| Immigrants | Costa Rica | 48.8 /100 | #175 | Average 29.2% |
| Hawaiians | 47.8 /100 | #176 | Average 29.2% |
| Immigrants | Bosnia and Herzegovina | 45.1 /100 | #177 | Average 29.2% |
| South American Indians | 43.2 /100 | #178 | Average 29.3% |