Nicaraguan vs Puget Sound Salish Single Mother Poverty
COMPARE
Nicaraguan
Puget Sound Salish
Single Mother Poverty
Single Mother Poverty Comparison
Nicaraguans
Puget Sound Salish
29.8%
SINGLE MOTHER POVERTY
12.4/ 100
METRIC RATING
212th/ 347
METRIC RANK
29.1%
SINGLE MOTHER POVERTY
55.1/ 100
METRIC RATING
171st/ 347
METRIC RANK
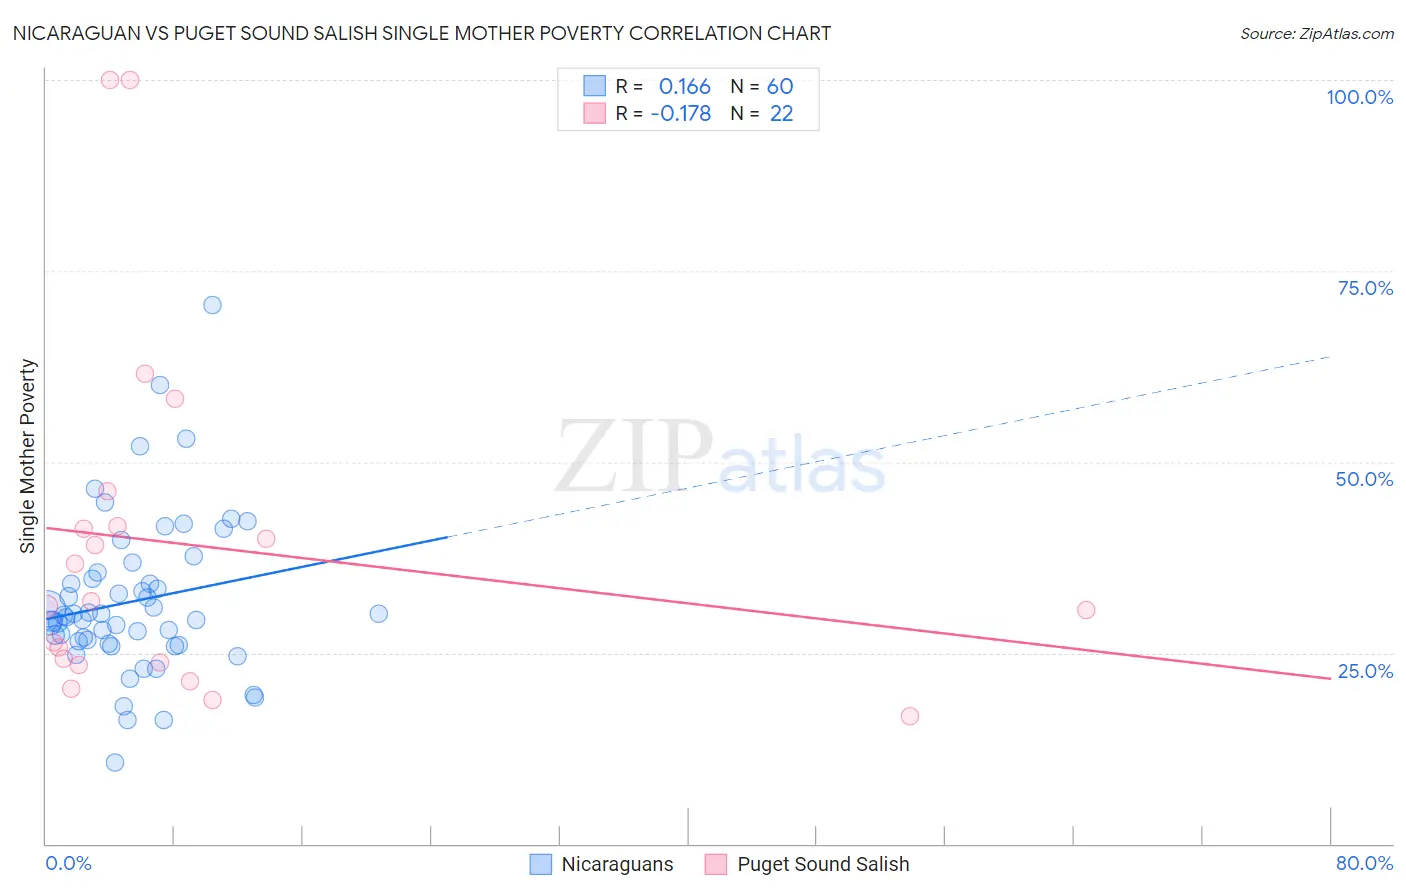
Nicaraguan vs Puget Sound Salish Single Mother Poverty Correlation Chart
The statistical analysis conducted on geographies consisting of 282,208,103 people shows a poor positive correlation between the proportion of Nicaraguans and poverty level among single mothers in the United States with a correlation coefficient (R) of 0.166 and weighted average of 29.8%. Similarly, the statistical analysis conducted on geographies consisting of 45,775,408 people shows a poor negative correlation between the proportion of Puget Sound Salish and poverty level among single mothers in the United States with a correlation coefficient (R) of -0.178 and weighted average of 29.1%, a difference of 2.6%.
Single Mother Poverty Correlation Summary
| Measurement | Nicaraguan | Puget Sound Salish |
| Minimum | 10.6% | 16.7% |
| Maximum | 70.6% | 100.0% |
| Range | 60.0% | 83.3% |
| Mean | 31.8% | 39.0% |
| Median | 29.7% | 31.4% |
| Interquartile 25% (IQ1) | 26.3% | 23.7% |
| Interquartile 75% (IQ3) | 35.1% | 41.6% |
| Interquartile Range (IQR) | 8.8% | 17.9% |
| Standard Deviation (Sample) | 10.4% | 23.1% |
| Standard Deviation (Population) | 10.3% | 22.5% |
Similar Demographics by Single Mother Poverty
Demographics Similar to Nicaraguans by Single Mother Poverty
In terms of single mother poverty, the demographic groups most similar to Nicaraguans are Guyanese (29.8%, a difference of 0.040%), Immigrants from Thailand (29.9%, a difference of 0.050%), Liberian (29.9%, a difference of 0.080%), Jamaican (29.9%, a difference of 0.080%), and Haitian (29.8%, a difference of 0.090%).
| Demographics | Rating | Rank | Single Mother Poverty |
| Czechoslovakians | 16.1 /100 | #205 | Poor 29.7% |
| Immigrants | Haiti | 15.8 /100 | #206 | Poor 29.7% |
| Immigrants | Panama | 15.5 /100 | #207 | Poor 29.8% |
| Immigrants | Guyana | 14.7 /100 | #208 | Poor 29.8% |
| Irish | 13.9 /100 | #209 | Poor 29.8% |
| Haitians | 13.3 /100 | #210 | Poor 29.8% |
| Guyanese | 12.8 /100 | #211 | Poor 29.8% |
| Nicaraguans | 12.4 /100 | #212 | Poor 29.8% |
| Immigrants | Thailand | 12.0 /100 | #213 | Poor 29.9% |
| Liberians | 11.7 /100 | #214 | Poor 29.9% |
| Jamaicans | 11.7 /100 | #215 | Poor 29.9% |
| Immigrants | Western Africa | 11.5 /100 | #216 | Poor 29.9% |
| Immigrants | Ghana | 11.3 /100 | #217 | Poor 29.9% |
| Hungarians | 10.3 /100 | #218 | Poor 29.9% |
| Finns | 9.3 /100 | #219 | Tragic 30.0% |
Demographics Similar to Puget Sound Salish by Single Mother Poverty
In terms of single mother poverty, the demographic groups most similar to Puget Sound Salish are New Zealander (29.1%, a difference of 0.0%), Carpatho Rusyn (29.1%, a difference of 0.060%), Immigrants from Uruguay (29.1%, a difference of 0.11%), European (29.1%, a difference of 0.12%), and Costa Rican (29.0%, a difference of 0.16%).
| Demographics | Rating | Rank | Single Mother Poverty |
| Immigrants | Kenya | 65.9 /100 | #164 | Good 28.9% |
| Arabs | 60.7 /100 | #165 | Good 29.0% |
| Inupiat | 60.4 /100 | #166 | Good 29.0% |
| Costa Ricans | 58.4 /100 | #167 | Average 29.0% |
| Europeans | 57.6 /100 | #168 | Average 29.1% |
| Immigrants | Uruguay | 57.2 /100 | #169 | Average 29.1% |
| New Zealanders | 55.1 /100 | #170 | Average 29.1% |
| Puget Sound Salish | 55.1 /100 | #171 | Average 29.1% |
| Carpatho Rusyns | 53.8 /100 | #172 | Average 29.1% |
| British | 50.6 /100 | #173 | Average 29.2% |
| Immigrants | Saudi Arabia | 50.0 /100 | #174 | Average 29.2% |
| Immigrants | Costa Rica | 48.8 /100 | #175 | Average 29.2% |
| Hawaiians | 47.8 /100 | #176 | Average 29.2% |
| Immigrants | Bosnia and Herzegovina | 45.1 /100 | #177 | Average 29.2% |
| South American Indians | 43.2 /100 | #178 | Average 29.3% |