Afghan vs Immigrants from Grenada 5th Grade
COMPARE
Afghan
Immigrants from Grenada
5th Grade
5th Grade Comparison
Afghans
Immigrants from Grenada
96.7%
5TH GRADE
0.2/ 100
METRIC RATING
270th/ 347
METRIC RANK
96.5%
5TH GRADE
0.0/ 100
METRIC RATING
293rd/ 347
METRIC RANK
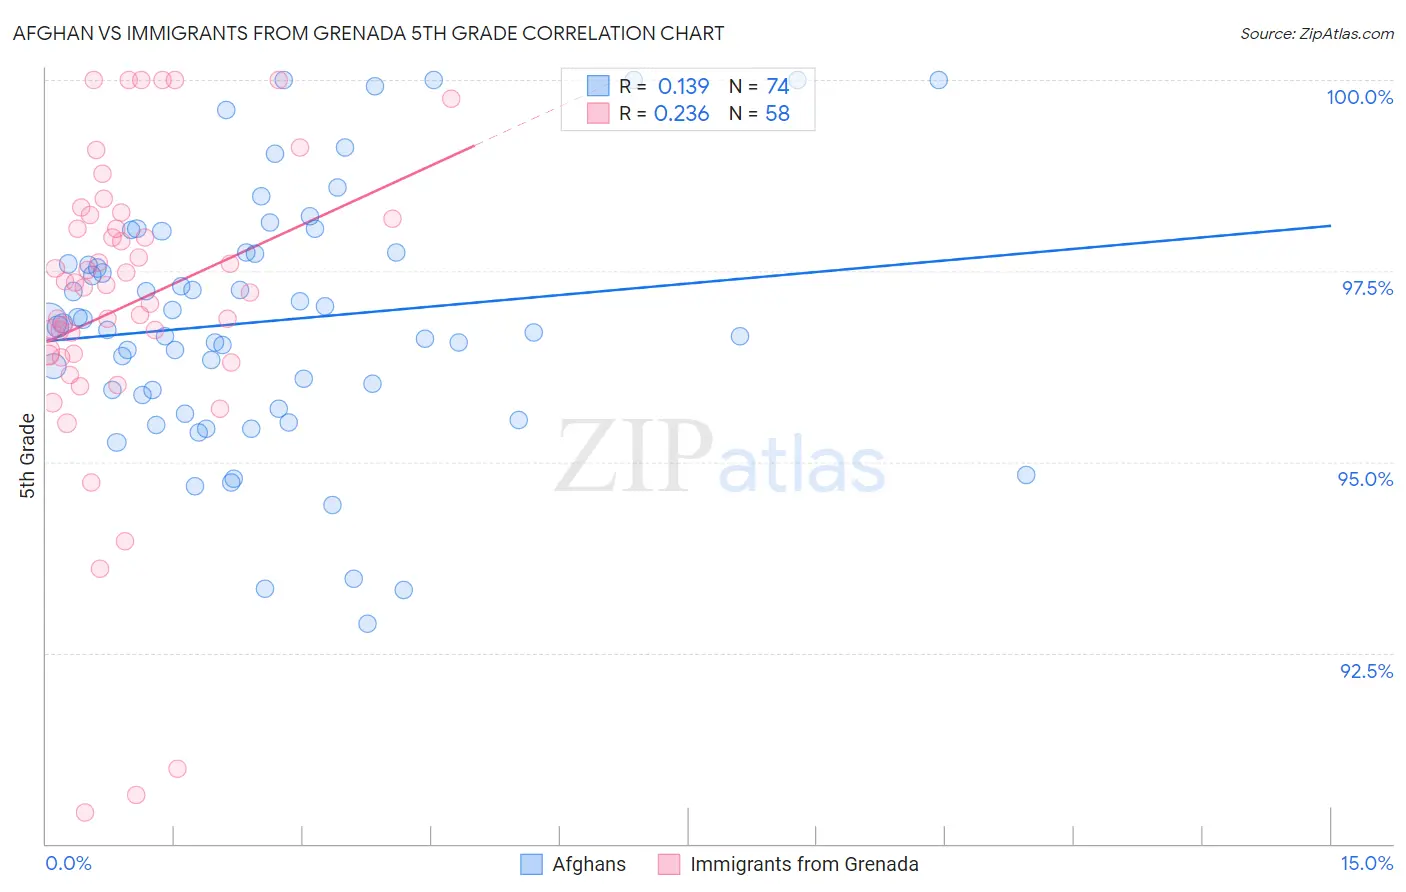
Afghan vs Immigrants from Grenada 5th Grade Correlation Chart
The statistical analysis conducted on geographies consisting of 148,851,685 people shows a poor positive correlation between the proportion of Afghans and percentage of population with at least 5th grade education in the United States with a correlation coefficient (R) of 0.139 and weighted average of 96.7%. Similarly, the statistical analysis conducted on geographies consisting of 67,199,790 people shows a weak positive correlation between the proportion of Immigrants from Grenada and percentage of population with at least 5th grade education in the United States with a correlation coefficient (R) of 0.236 and weighted average of 96.5%, a difference of 0.23%.
5th Grade Correlation Summary
| Measurement | Afghan | Immigrants from Grenada |
| Minimum | 92.9% | 90.4% |
| Maximum | 100.0% | 100.0% |
| Range | 7.1% | 9.6% |
| Mean | 96.8% | 97.1% |
| Median | 96.8% | 97.3% |
| Interquartile 25% (IQ1) | 95.9% | 96.4% |
| Interquartile 75% (IQ3) | 97.7% | 98.2% |
| Interquartile Range (IQR) | 1.9% | 1.8% |
| Standard Deviation (Sample) | 1.6% | 2.1% |
| Standard Deviation (Population) | 1.6% | 2.1% |
Similar Demographics by 5th Grade
Demographics Similar to Afghans by 5th Grade
In terms of 5th grade, the demographic groups most similar to Afghans are Immigrants from Hong Kong (96.7%, a difference of 0.0%), Trinidadian and Tobagonian (96.7%, a difference of 0.020%), Yaqui (96.7%, a difference of 0.020%), Immigrants from Cameroon (96.7%, a difference of 0.020%), and Immigrants from Peru (96.6%, a difference of 0.030%).
| Demographics | Rating | Rank | 5th Grade |
| Immigrants | Uzbekistan | 0.3 /100 | #263 | Tragic 96.8% |
| West Indians | 0.3 /100 | #264 | Tragic 96.8% |
| Taiwanese | 0.3 /100 | #265 | Tragic 96.7% |
| Immigrants | Nigeria | 0.3 /100 | #266 | Tragic 96.7% |
| Immigrants | South America | 0.3 /100 | #267 | Tragic 96.7% |
| Armenians | 0.3 /100 | #268 | Tragic 96.7% |
| Ghanaians | 0.2 /100 | #269 | Tragic 96.7% |
| Afghans | 0.2 /100 | #270 | Tragic 96.7% |
| Immigrants | Hong Kong | 0.2 /100 | #271 | Tragic 96.7% |
| Trinidadians and Tobagonians | 0.1 /100 | #272 | Tragic 96.7% |
| Yaqui | 0.1 /100 | #273 | Tragic 96.7% |
| Immigrants | Cameroon | 0.1 /100 | #274 | Tragic 96.7% |
| Immigrants | Peru | 0.1 /100 | #275 | Tragic 96.6% |
| Cubans | 0.1 /100 | #276 | Tragic 96.6% |
| Immigrants | Bolivia | 0.1 /100 | #277 | Tragic 96.6% |
Demographics Similar to Immigrants from Grenada by 5th Grade
In terms of 5th grade, the demographic groups most similar to Immigrants from Grenada are Somali (96.5%, a difference of 0.010%), British West Indian (96.5%, a difference of 0.020%), Malaysian (96.5%, a difference of 0.020%), Immigrants from West Indies (96.5%, a difference of 0.040%), and Immigrants from Eritrea (96.4%, a difference of 0.040%).
| Demographics | Rating | Rank | 5th Grade |
| Immigrants | Thailand | 0.1 /100 | #286 | Tragic 96.6% |
| Immigrants | Afghanistan | 0.1 /100 | #287 | Tragic 96.6% |
| Immigrants | Barbados | 0.0 /100 | #288 | Tragic 96.6% |
| Immigrants | West Indies | 0.0 /100 | #289 | Tragic 96.5% |
| British West Indians | 0.0 /100 | #290 | Tragic 96.5% |
| Malaysians | 0.0 /100 | #291 | Tragic 96.5% |
| Somalis | 0.0 /100 | #292 | Tragic 96.5% |
| Immigrants | Grenada | 0.0 /100 | #293 | Tragic 96.5% |
| Immigrants | Eritrea | 0.0 /100 | #294 | Tragic 96.4% |
| Immigrants | Somalia | 0.0 /100 | #295 | Tragic 96.4% |
| Immigrants | South Eastern Asia | 0.0 /100 | #296 | Tragic 96.3% |
| Haitians | 0.0 /100 | #297 | Tragic 96.3% |
| Immigrants | Dominica | 0.0 /100 | #298 | Tragic 96.2% |
| Immigrants | Immigrants | 0.0 /100 | #299 | Tragic 96.2% |
| Sri Lankans | 0.0 /100 | #300 | Tragic 96.1% |