Afghan vs Immigrants from Grenada Unemployment Among Ages 25 to 29 years
COMPARE
Afghan
Immigrants from Grenada
Unemployment Among Ages 25 to 29 years
Unemployment Among Ages 25 to 29 years Comparison
Afghans
Immigrants from Grenada
6.4%
UNEMPLOYMENT AMONG AGES 25 TO 29 YEARS
92.5/ 100
METRIC RATING
95th/ 347
METRIC RANK
8.4%
UNEMPLOYMENT AMONG AGES 25 TO 29 YEARS
0.0/ 100
METRIC RATING
316th/ 347
METRIC RANK
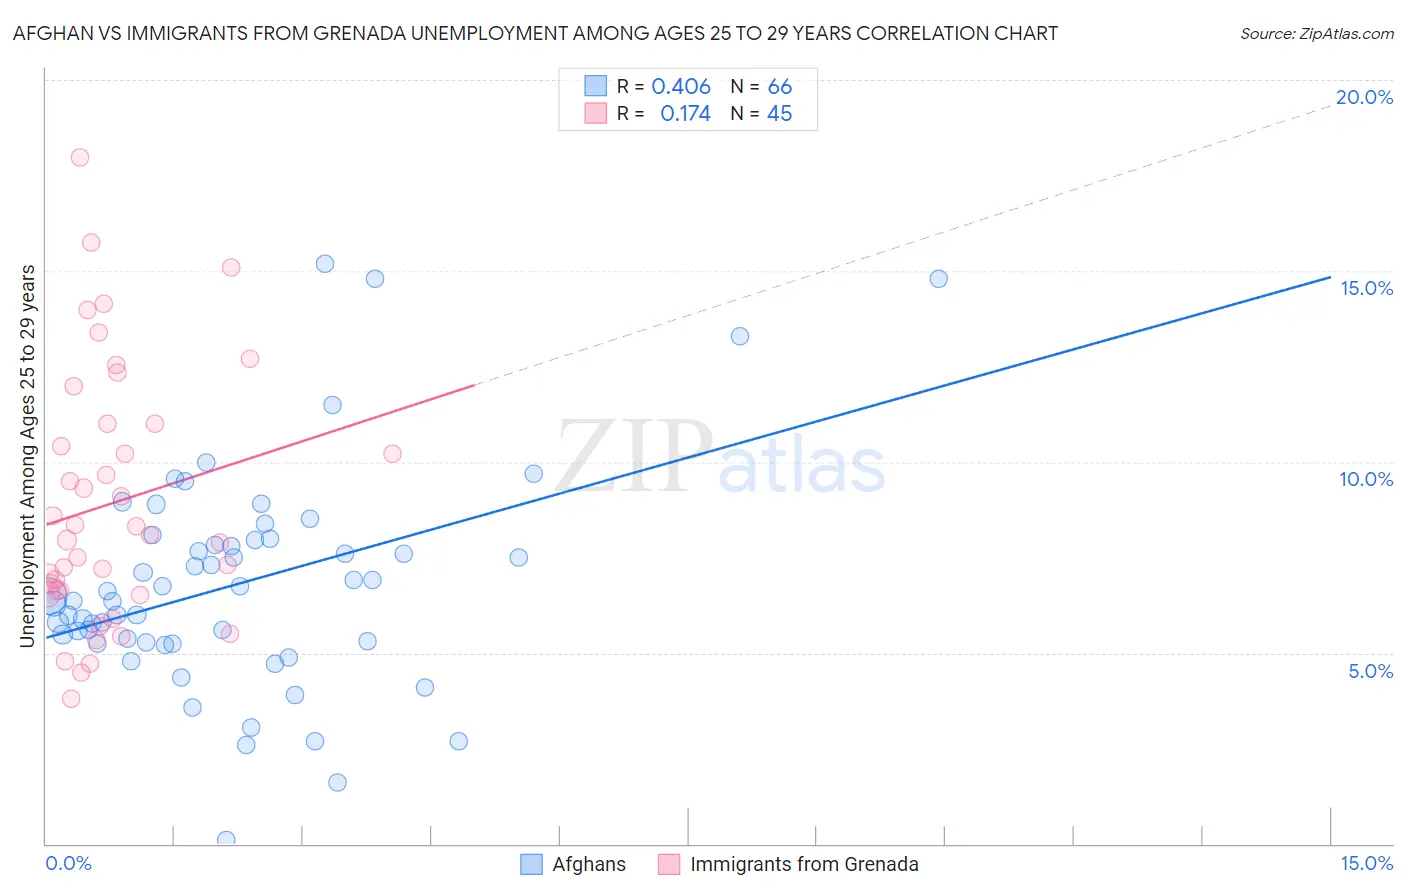
Afghan vs Immigrants from Grenada Unemployment Among Ages 25 to 29 years Correlation Chart
The statistical analysis conducted on geographies consisting of 147,163,258 people shows a moderate positive correlation between the proportion of Afghans and unemployment rate among population between the ages 25 and 29 in the United States with a correlation coefficient (R) of 0.406 and weighted average of 6.4%. Similarly, the statistical analysis conducted on geographies consisting of 66,445,528 people shows a poor positive correlation between the proportion of Immigrants from Grenada and unemployment rate among population between the ages 25 and 29 in the United States with a correlation coefficient (R) of 0.174 and weighted average of 8.4%, a difference of 32.2%.
Unemployment Among Ages 25 to 29 years Correlation Summary
| Measurement | Afghan | Immigrants from Grenada |
| Minimum | 0.10% | 3.8% |
| Maximum | 15.2% | 18.0% |
| Range | 15.1% | 14.2% |
| Mean | 6.8% | 8.9% |
| Median | 6.4% | 8.1% |
| Interquartile 25% (IQ1) | 5.3% | 6.6% |
| Interquartile 75% (IQ3) | 7.9% | 11.0% |
| Interquartile Range (IQR) | 2.7% | 4.4% |
| Standard Deviation (Sample) | 2.9% | 3.3% |
| Standard Deviation (Population) | 2.8% | 3.3% |
Similar Demographics by Unemployment Among Ages 25 to 29 years
Demographics Similar to Afghans by Unemployment Among Ages 25 to 29 years
In terms of unemployment among ages 25 to 29 years, the demographic groups most similar to Afghans are Immigrants from Brazil (6.4%, a difference of 0.080%), Immigrants from Eastern Europe (6.4%, a difference of 0.14%), Serbian (6.4%, a difference of 0.17%), Zimbabwean (6.4%, a difference of 0.24%), and Iraqi (6.4%, a difference of 0.25%).
| Demographics | Rating | Rank | Unemployment Among Ages 25 to 29 years |
| Immigrants | Indonesia | 94.5 /100 | #88 | Exceptional 6.4% |
| Immigrants | Oceania | 94.1 /100 | #89 | Exceptional 6.4% |
| Lebanese | 93.9 /100 | #90 | Exceptional 6.4% |
| Egyptians | 93.9 /100 | #91 | Exceptional 6.4% |
| Immigrants | North Macedonia | 93.6 /100 | #92 | Exceptional 6.4% |
| Australians | 93.6 /100 | #93 | Exceptional 6.4% |
| Zimbabweans | 93.5 /100 | #94 | Exceptional 6.4% |
| Afghans | 92.5 /100 | #95 | Exceptional 6.4% |
| Immigrants | Brazil | 92.1 /100 | #96 | Exceptional 6.4% |
| Immigrants | Eastern Europe | 91.9 /100 | #97 | Exceptional 6.4% |
| Serbians | 91.7 /100 | #98 | Exceptional 6.4% |
| Iraqis | 91.3 /100 | #99 | Exceptional 6.4% |
| Uruguayans | 91.2 /100 | #100 | Exceptional 6.4% |
| Immigrants | Ireland | 91.1 /100 | #101 | Exceptional 6.4% |
| British | 90.5 /100 | #102 | Exceptional 6.4% |
Demographics Similar to Immigrants from Grenada by Unemployment Among Ages 25 to 29 years
In terms of unemployment among ages 25 to 29 years, the demographic groups most similar to Immigrants from Grenada are British West Indian (8.4%, a difference of 0.070%), Immigrants from Guyana (8.5%, a difference of 0.090%), Guyanese (8.5%, a difference of 0.35%), Immigrants from Armenia (8.5%, a difference of 0.57%), and Immigrants from Dominica (8.4%, a difference of 0.66%).
| Demographics | Rating | Rank | Unemployment Among Ages 25 to 29 years |
| Immigrants | Haiti | 0.0 /100 | #309 | Tragic 8.1% |
| U.S. Virgin Islanders | 0.0 /100 | #310 | Tragic 8.1% |
| Immigrants | Azores | 0.0 /100 | #311 | Tragic 8.1% |
| Dutch West Indians | 0.0 /100 | #312 | Tragic 8.2% |
| Immigrants | St. Vincent and the Grenadines | 0.0 /100 | #313 | Tragic 8.4% |
| Immigrants | Dominica | 0.0 /100 | #314 | Tragic 8.4% |
| British West Indians | 0.0 /100 | #315 | Tragic 8.4% |
| Immigrants | Grenada | 0.0 /100 | #316 | Tragic 8.4% |
| Immigrants | Guyana | 0.0 /100 | #317 | Tragic 8.5% |
| Guyanese | 0.0 /100 | #318 | Tragic 8.5% |
| Immigrants | Armenia | 0.0 /100 | #319 | Tragic 8.5% |
| Blacks/African Americans | 0.0 /100 | #320 | Tragic 8.6% |
| Immigrants | Dominican Republic | 0.0 /100 | #321 | Tragic 8.6% |
| Tlingit-Haida | 0.0 /100 | #322 | Tragic 8.7% |
| Dominicans | 0.0 /100 | #323 | Tragic 8.7% |