Yup'ik vs Argentinean In Labor Force | Age > 16
COMPARE
Yup'ik
Argentinean
In Labor Force | Age > 16
In Labor Force | Age > 16 Comparison
Yup'ik
Argentineans
62.7%
IN LABOR FORCE | AGE > 16
0.0/ 100
METRIC RATING
316th/ 347
METRIC RANK
65.7%
IN LABOR FORCE | AGE > 16
96.7/ 100
METRIC RATING
116th/ 347
METRIC RANK
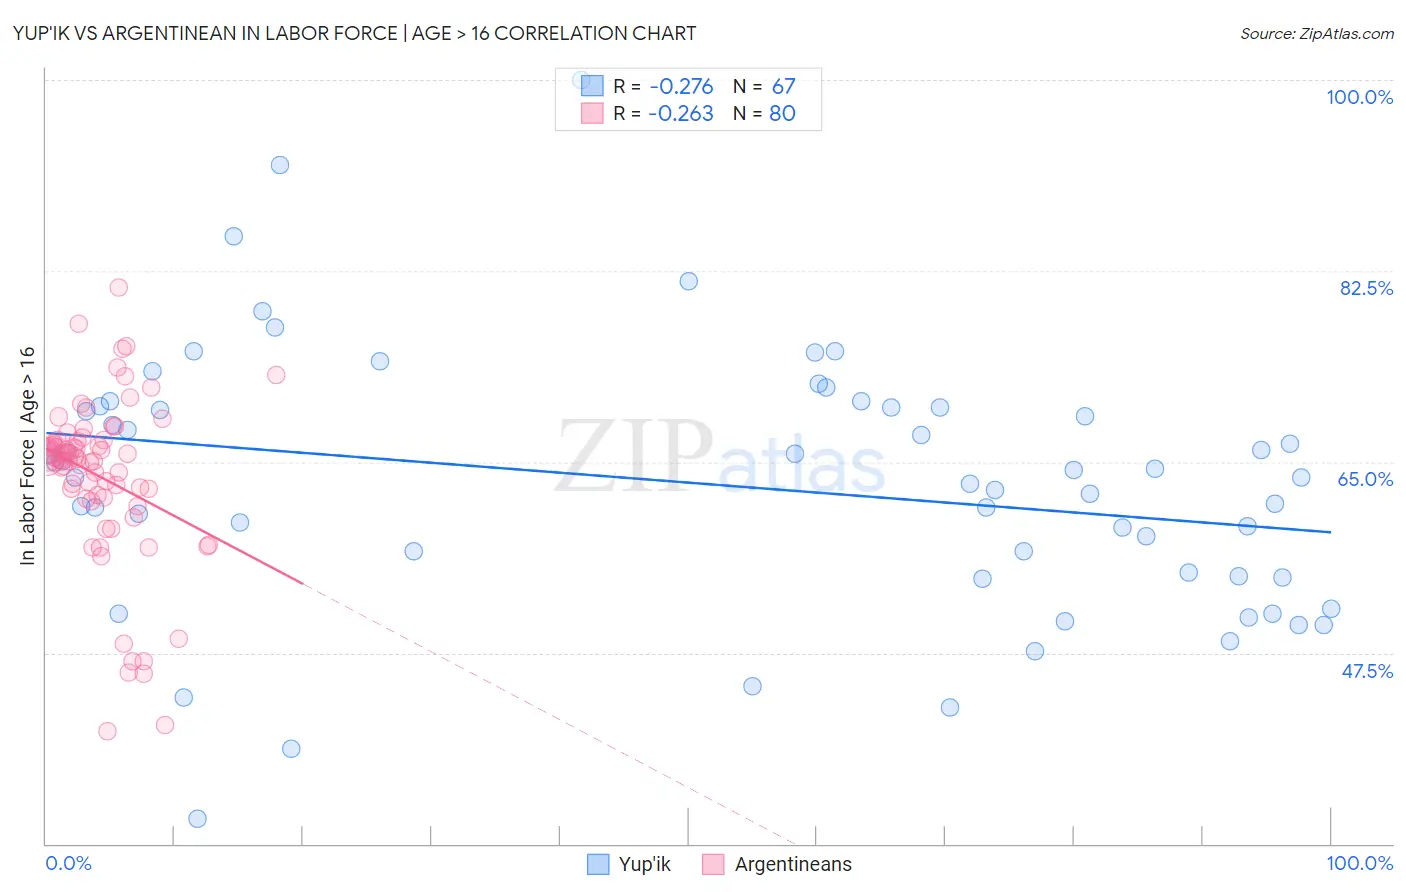
Yup'ik vs Argentinean In Labor Force | Age > 16 Correlation Chart
The statistical analysis conducted on geographies consisting of 39,964,003 people shows a weak negative correlation between the proportion of Yup'ik and labor force participation rate among population ages 16 and over in the United States with a correlation coefficient (R) of -0.276 and weighted average of 62.7%. Similarly, the statistical analysis conducted on geographies consisting of 297,149,782 people shows a weak negative correlation between the proportion of Argentineans and labor force participation rate among population ages 16 and over in the United States with a correlation coefficient (R) of -0.263 and weighted average of 65.7%, a difference of 4.9%.
In Labor Force | Age > 16 Correlation Summary
| Measurement | Yup'ik | Argentinean |
| Minimum | 32.3% | 40.3% |
| Maximum | 100.0% | 81.0% |
| Range | 67.7% | 40.7% |
| Mean | 63.0% | 63.6% |
| Median | 63.6% | 65.3% |
| Interquartile 25% (IQ1) | 54.5% | 61.7% |
| Interquartile 75% (IQ3) | 70.0% | 66.9% |
| Interquartile Range (IQR) | 15.5% | 5.2% |
| Standard Deviation (Sample) | 12.0% | 7.7% |
| Standard Deviation (Population) | 11.9% | 7.6% |
Similar Demographics by In Labor Force | Age > 16
Demographics Similar to Yup'ik by In Labor Force | Age > 16
In terms of in labor force | age > 16, the demographic groups most similar to Yup'ik are Potawatomi (62.8%, a difference of 0.22%), Kiowa (62.4%, a difference of 0.45%), Yaqui (63.0%, a difference of 0.56%), Chickasaw (62.3%, a difference of 0.64%), and Chippewa (63.1%, a difference of 0.66%).
| Demographics | Rating | Rank | In Labor Force | Age > 16 |
| Scotch-Irish | 0.0 /100 | #309 | Tragic 63.3% |
| Shoshone | 0.0 /100 | #310 | Tragic 63.2% |
| Blackfeet | 0.0 /100 | #311 | Tragic 63.2% |
| Iroquois | 0.0 /100 | #312 | Tragic 63.2% |
| Chippewa | 0.0 /100 | #313 | Tragic 63.1% |
| Yaqui | 0.0 /100 | #314 | Tragic 63.0% |
| Potawatomi | 0.0 /100 | #315 | Tragic 62.8% |
| Yup'ik | 0.0 /100 | #316 | Tragic 62.7% |
| Kiowa | 0.0 /100 | #317 | Tragic 62.4% |
| Chickasaw | 0.0 /100 | #318 | Tragic 62.3% |
| Arapaho | 0.0 /100 | #319 | Tragic 62.1% |
| Yakama | 0.0 /100 | #320 | Tragic 62.1% |
| Americans | 0.0 /100 | #321 | Tragic 62.1% |
| Ottawa | 0.0 /100 | #322 | Tragic 62.0% |
| Seminole | 0.0 /100 | #323 | Tragic 62.0% |
Demographics Similar to Argentineans by In Labor Force | Age > 16
In terms of in labor force | age > 16, the demographic groups most similar to Argentineans are Immigrants from Indonesia (65.7%, a difference of 0.010%), Immigrants from Iran (65.7%, a difference of 0.010%), Immigrants from Thailand (65.7%, a difference of 0.010%), Immigrants from France (65.7%, a difference of 0.020%), and Pakistani (65.8%, a difference of 0.040%).
| Demographics | Rating | Rank | In Labor Force | Age > 16 |
| Immigrants | Japan | 98.0 /100 | #109 | Exceptional 65.8% |
| Japanese | 97.7 /100 | #110 | Exceptional 65.8% |
| Immigrants | Honduras | 97.5 /100 | #111 | Exceptional 65.8% |
| Laotians | 97.4 /100 | #112 | Exceptional 65.8% |
| Pakistanis | 97.1 /100 | #113 | Exceptional 65.8% |
| Hondurans | 97.1 /100 | #114 | Exceptional 65.8% |
| Immigrants | Indonesia | 96.8 /100 | #115 | Exceptional 65.7% |
| Argentineans | 96.7 /100 | #116 | Exceptional 65.7% |
| Immigrants | Iran | 96.6 /100 | #117 | Exceptional 65.7% |
| Immigrants | Thailand | 96.6 /100 | #118 | Exceptional 65.7% |
| Immigrants | France | 96.4 /100 | #119 | Exceptional 65.7% |
| Immigrants | Hong Kong | 96.2 /100 | #120 | Exceptional 65.7% |
| New Zealanders | 96.0 /100 | #121 | Exceptional 65.7% |
| Immigrants | Ecuador | 95.9 /100 | #122 | Exceptional 65.7% |
| Immigrants | Iraq | 95.5 /100 | #123 | Exceptional 65.7% |