Yup'ik vs Arab In Labor Force | Age > 16
COMPARE
Yup'ik
Arab
In Labor Force | Age > 16
In Labor Force | Age > 16 Comparison
Yup'ik
Arabs
62.7%
IN LABOR FORCE | AGE > 16
0.0/ 100
METRIC RATING
316th/ 347
METRIC RANK
65.2%
IN LABOR FORCE | AGE > 16
62.4/ 100
METRIC RATING
169th/ 347
METRIC RANK
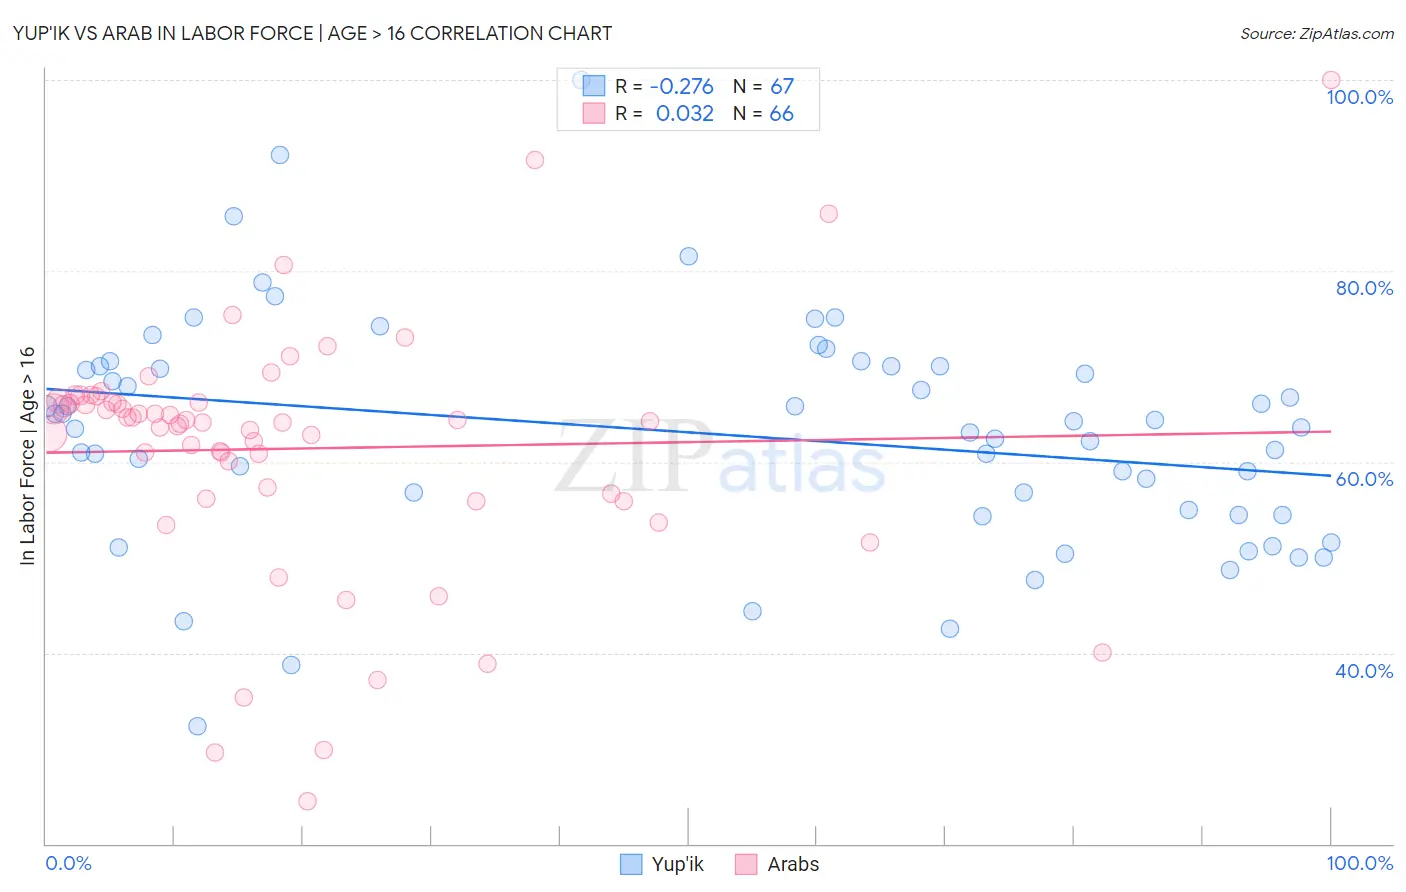
Yup'ik vs Arab In Labor Force | Age > 16 Correlation Chart
The statistical analysis conducted on geographies consisting of 39,964,003 people shows a weak negative correlation between the proportion of Yup'ik and labor force participation rate among population ages 16 and over in the United States with a correlation coefficient (R) of -0.276 and weighted average of 62.7%. Similarly, the statistical analysis conducted on geographies consisting of 486,878,981 people shows no correlation between the proportion of Arabs and labor force participation rate among population ages 16 and over in the United States with a correlation coefficient (R) of 0.032 and weighted average of 65.2%, a difference of 4.0%.
In Labor Force | Age > 16 Correlation Summary
| Measurement | Yup'ik | Arab |
| Minimum | 32.3% | 24.4% |
| Maximum | 100.0% | 100.0% |
| Range | 67.7% | 75.6% |
| Mean | 63.0% | 61.4% |
| Median | 63.6% | 64.2% |
| Interquartile 25% (IQ1) | 54.5% | 56.7% |
| Interquartile 75% (IQ3) | 70.0% | 66.2% |
| Interquartile Range (IQR) | 15.5% | 9.5% |
| Standard Deviation (Sample) | 12.0% | 13.1% |
| Standard Deviation (Population) | 11.9% | 13.0% |
Similar Demographics by In Labor Force | Age > 16
Demographics Similar to Yup'ik by In Labor Force | Age > 16
In terms of in labor force | age > 16, the demographic groups most similar to Yup'ik are Potawatomi (62.8%, a difference of 0.22%), Kiowa (62.4%, a difference of 0.45%), Yaqui (63.0%, a difference of 0.56%), Chickasaw (62.3%, a difference of 0.64%), and Chippewa (63.1%, a difference of 0.66%).
| Demographics | Rating | Rank | In Labor Force | Age > 16 |
| Scotch-Irish | 0.0 /100 | #309 | Tragic 63.3% |
| Shoshone | 0.0 /100 | #310 | Tragic 63.2% |
| Blackfeet | 0.0 /100 | #311 | Tragic 63.2% |
| Iroquois | 0.0 /100 | #312 | Tragic 63.2% |
| Chippewa | 0.0 /100 | #313 | Tragic 63.1% |
| Yaqui | 0.0 /100 | #314 | Tragic 63.0% |
| Potawatomi | 0.0 /100 | #315 | Tragic 62.8% |
| Yup'ik | 0.0 /100 | #316 | Tragic 62.7% |
| Kiowa | 0.0 /100 | #317 | Tragic 62.4% |
| Chickasaw | 0.0 /100 | #318 | Tragic 62.3% |
| Arapaho | 0.0 /100 | #319 | Tragic 62.1% |
| Yakama | 0.0 /100 | #320 | Tragic 62.1% |
| Americans | 0.0 /100 | #321 | Tragic 62.1% |
| Ottawa | 0.0 /100 | #322 | Tragic 62.0% |
| Seminole | 0.0 /100 | #323 | Tragic 62.0% |
Demographics Similar to Arabs by In Labor Force | Age > 16
In terms of in labor force | age > 16, the demographic groups most similar to Arabs are Serbian (65.2%, a difference of 0.010%), Immigrants from Israel (65.2%, a difference of 0.010%), Israeli (65.2%, a difference of 0.010%), Immigrants from Sweden (65.2%, a difference of 0.010%), and Immigrants from Belarus (65.2%, a difference of 0.040%).
| Demographics | Rating | Rank | In Labor Force | Age > 16 |
| Albanians | 70.8 /100 | #162 | Good 65.3% |
| South Africans | 69.8 /100 | #163 | Good 65.3% |
| Danes | 68.8 /100 | #164 | Good 65.3% |
| Immigrants | Kazakhstan | 68.1 /100 | #165 | Good 65.3% |
| Immigrants | Western Asia | 67.3 /100 | #166 | Good 65.3% |
| Immigrants | Belarus | 66.0 /100 | #167 | Good 65.2% |
| Serbians | 63.5 /100 | #168 | Good 65.2% |
| Arabs | 62.4 /100 | #169 | Good 65.2% |
| Immigrants | Israel | 61.7 /100 | #170 | Good 65.2% |
| Israelis | 61.6 /100 | #171 | Good 65.2% |
| Immigrants | Sweden | 61.3 /100 | #172 | Good 65.2% |
| Immigrants | Ukraine | 53.7 /100 | #173 | Average 65.1% |
| Macedonians | 50.0 /100 | #174 | Average 65.1% |
| Nicaraguans | 49.7 /100 | #175 | Average 65.1% |
| Swedes | 47.4 /100 | #176 | Average 65.1% |