Immigrants from South Eastern Asia vs Argentinean In Labor Force | Age > 16
COMPARE
Immigrants from South Eastern Asia
Argentinean
In Labor Force | Age > 16
In Labor Force | Age > 16 Comparison
Immigrants from South Eastern Asia
Argentineans
65.9%
IN LABOR FORCE | AGE > 16
98.5/ 100
METRIC RATING
103rd/ 347
METRIC RANK
65.7%
IN LABOR FORCE | AGE > 16
96.7/ 100
METRIC RATING
116th/ 347
METRIC RANK
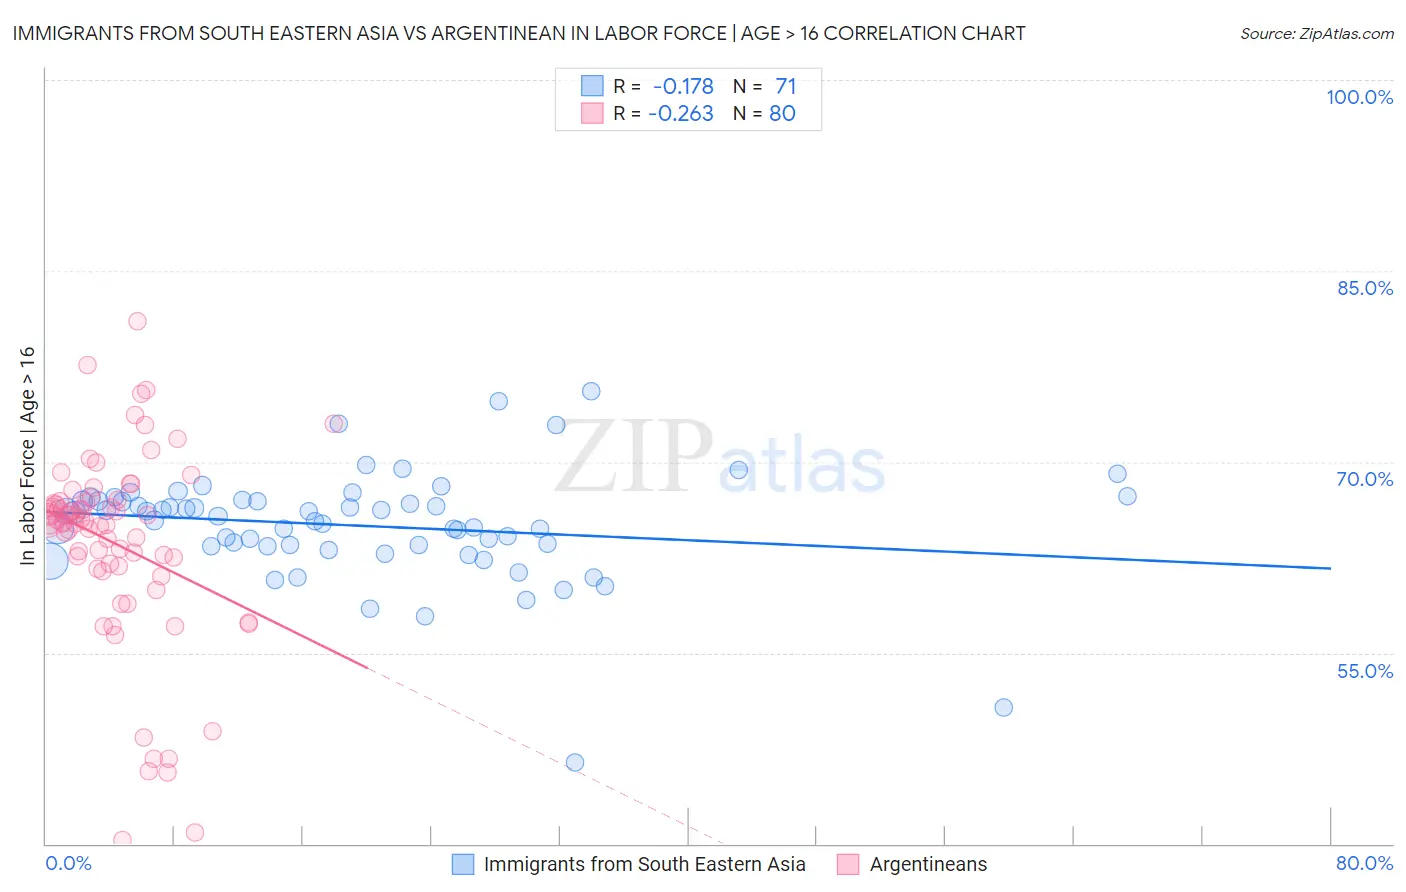
Immigrants from South Eastern Asia vs Argentinean In Labor Force | Age > 16 Correlation Chart
The statistical analysis conducted on geographies consisting of 512,696,478 people shows a poor negative correlation between the proportion of Immigrants from South Eastern Asia and labor force participation rate among population ages 16 and over in the United States with a correlation coefficient (R) of -0.178 and weighted average of 65.9%. Similarly, the statistical analysis conducted on geographies consisting of 297,149,782 people shows a weak negative correlation between the proportion of Argentineans and labor force participation rate among population ages 16 and over in the United States with a correlation coefficient (R) of -0.263 and weighted average of 65.7%, a difference of 0.23%.
In Labor Force | Age > 16 Correlation Summary
| Measurement | Immigrants from South Eastern Asia | Argentinean |
| Minimum | 46.4% | 40.3% |
| Maximum | 75.5% | 81.0% |
| Range | 29.1% | 40.7% |
| Mean | 65.0% | 63.6% |
| Median | 65.7% | 65.3% |
| Interquartile 25% (IQ1) | 63.3% | 61.7% |
| Interquartile 75% (IQ3) | 66.9% | 66.9% |
| Interquartile Range (IQR) | 3.6% | 5.2% |
| Standard Deviation (Sample) | 4.4% | 7.7% |
| Standard Deviation (Population) | 4.4% | 7.6% |
Demographics Similar to Immigrants from South Eastern Asia and Argentineans by In Labor Force | Age > 16
In terms of in labor force | age > 16, the demographic groups most similar to Immigrants from South Eastern Asia are Palestinian (65.9%, a difference of 0.010%), Immigrants from Colombia (65.9%, a difference of 0.020%), Uruguayan (65.9%, a difference of 0.020%), Colombian (65.9%, a difference of 0.020%), and Immigrants from Australia (65.9%, a difference of 0.030%). Similarly, the demographic groups most similar to Argentineans are Immigrants from Indonesia (65.7%, a difference of 0.010%), Immigrants from Iran (65.7%, a difference of 0.010%), Immigrants from Thailand (65.7%, a difference of 0.010%), Immigrants from France (65.7%, a difference of 0.020%), and Pakistani (65.8%, a difference of 0.040%).
| Demographics | Rating | Rank | In Labor Force | Age > 16 |
| Immigrants | Australia | 98.7 /100 | #99 | Exceptional 65.9% |
| Okinawans | 98.7 /100 | #100 | Exceptional 65.9% |
| Immigrants | Colombia | 98.6 /100 | #101 | Exceptional 65.9% |
| Uruguayans | 98.6 /100 | #102 | Exceptional 65.9% |
| Immigrants | South Eastern Asia | 98.5 /100 | #103 | Exceptional 65.9% |
| Palestinians | 98.5 /100 | #104 | Exceptional 65.9% |
| Colombians | 98.4 /100 | #105 | Exceptional 65.9% |
| Immigrants | Serbia | 98.1 /100 | #106 | Exceptional 65.8% |
| Immigrants | Poland | 98.1 /100 | #107 | Exceptional 65.8% |
| Immigrants | Spain | 98.0 /100 | #108 | Exceptional 65.8% |
| Immigrants | Japan | 98.0 /100 | #109 | Exceptional 65.8% |
| Japanese | 97.7 /100 | #110 | Exceptional 65.8% |
| Immigrants | Honduras | 97.5 /100 | #111 | Exceptional 65.8% |
| Laotians | 97.4 /100 | #112 | Exceptional 65.8% |
| Pakistanis | 97.1 /100 | #113 | Exceptional 65.8% |
| Hondurans | 97.1 /100 | #114 | Exceptional 65.8% |
| Immigrants | Indonesia | 96.8 /100 | #115 | Exceptional 65.7% |
| Argentineans | 96.7 /100 | #116 | Exceptional 65.7% |
| Immigrants | Iran | 96.6 /100 | #117 | Exceptional 65.7% |
| Immigrants | Thailand | 96.6 /100 | #118 | Exceptional 65.7% |
| Immigrants | France | 96.4 /100 | #119 | Exceptional 65.7% |