Pima vs Spanish American In Labor Force | Age > 16
COMPARE
Pima
Spanish American
In Labor Force | Age > 16
In Labor Force | Age > 16 Comparison
Pima
Spanish Americans
57.4%
IN LABOR FORCE | AGE > 16
0.0/ 100
METRIC RATING
344th/ 347
METRIC RANK
63.6%
IN LABOR FORCE | AGE > 16
0.0/ 100
METRIC RATING
301st/ 347
METRIC RANK
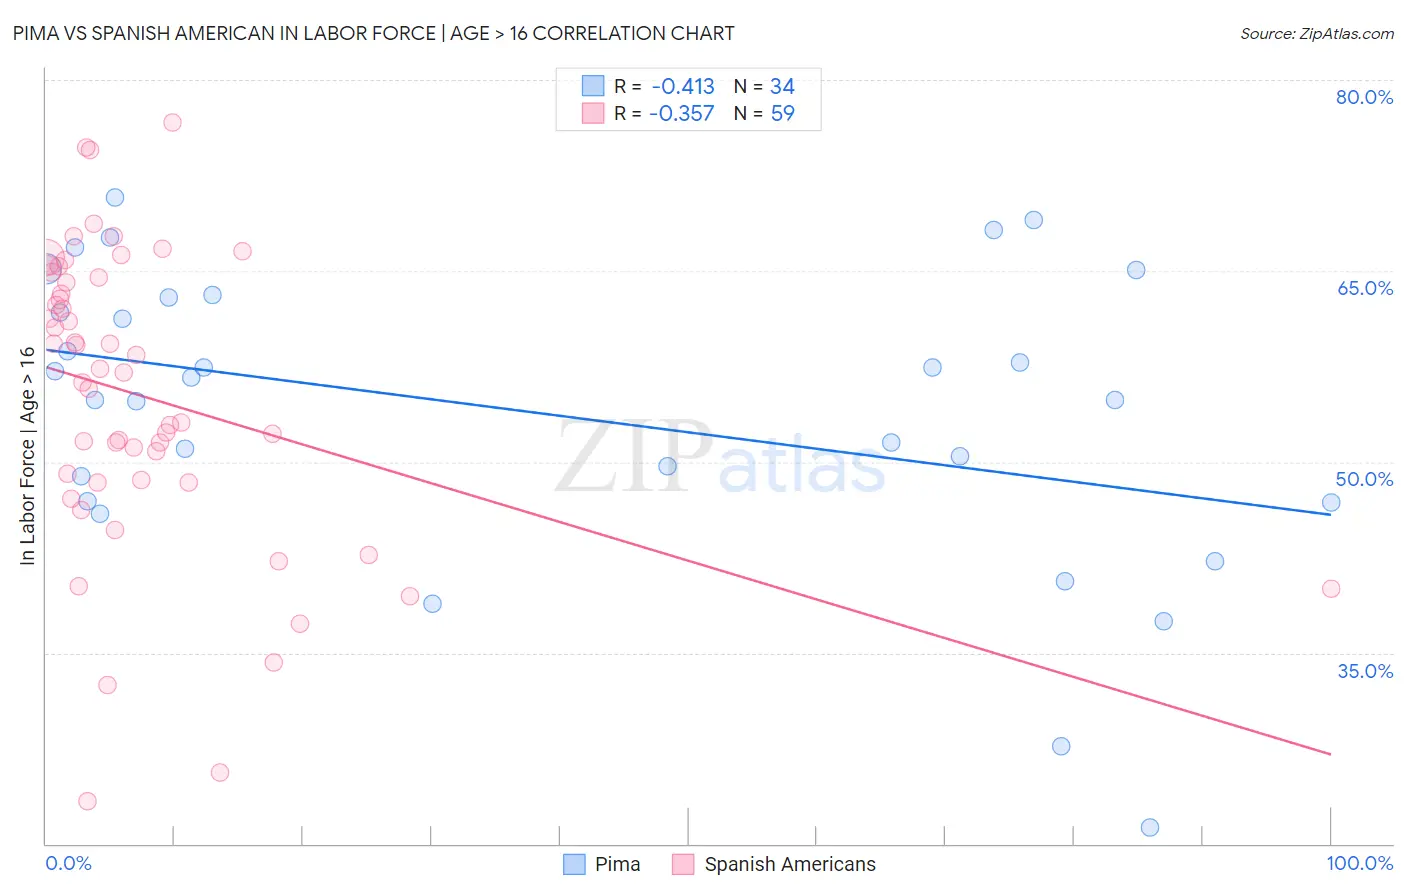
Pima vs Spanish American In Labor Force | Age > 16 Correlation Chart
The statistical analysis conducted on geographies consisting of 61,542,645 people shows a moderate negative correlation between the proportion of Pima and labor force participation rate among population ages 16 and over in the United States with a correlation coefficient (R) of -0.413 and weighted average of 57.4%. Similarly, the statistical analysis conducted on geographies consisting of 103,168,383 people shows a mild negative correlation between the proportion of Spanish Americans and labor force participation rate among population ages 16 and over in the United States with a correlation coefficient (R) of -0.357 and weighted average of 63.6%, a difference of 10.7%.
In Labor Force | Age > 16 Correlation Summary
| Measurement | Pima | Spanish American |
| Minimum | 21.3% | 23.3% |
| Maximum | 70.8% | 76.7% |
| Range | 49.5% | 53.4% |
| Mean | 53.8% | 55.1% |
| Median | 55.8% | 57.0% |
| Interquartile 25% (IQ1) | 46.9% | 48.4% |
| Interquartile 75% (IQ3) | 62.9% | 64.5% |
| Interquartile Range (IQR) | 16.0% | 16.1% |
| Standard Deviation (Sample) | 11.6% | 11.7% |
| Standard Deviation (Population) | 11.5% | 11.6% |
Similar Demographics by In Labor Force | Age > 16
Demographics Similar to Pima by In Labor Force | Age > 16
In terms of in labor force | age > 16, the demographic groups most similar to Pima are Tohono O'odham (57.2%, a difference of 0.29%), Yuman (57.8%, a difference of 0.70%), Lumbee (56.8%, a difference of 1.1%), Puerto Rican (58.1%, a difference of 1.2%), and Navajo (56.6%, a difference of 1.5%).
| Demographics | Rating | Rank | In Labor Force | Age > 16 |
| Paiute | 0.0 /100 | #333 | Tragic 60.7% |
| Apache | 0.0 /100 | #334 | Tragic 60.7% |
| Natives/Alaskans | 0.0 /100 | #335 | Tragic 60.6% |
| Menominee | 0.0 /100 | #336 | Tragic 60.6% |
| Colville | 0.0 /100 | #337 | Tragic 59.8% |
| Immigrants | Yemen | 0.0 /100 | #338 | Tragic 59.6% |
| Houma | 0.0 /100 | #339 | Tragic 59.5% |
| Pueblo | 0.0 /100 | #340 | Tragic 59.3% |
| Hopi | 0.0 /100 | #341 | Tragic 58.4% |
| Puerto Ricans | 0.0 /100 | #342 | Tragic 58.1% |
| Yuman | 0.0 /100 | #343 | Tragic 57.8% |
| Pima | 0.0 /100 | #344 | Tragic 57.4% |
| Tohono O'odham | 0.0 /100 | #345 | Tragic 57.2% |
| Lumbee | 0.0 /100 | #346 | Tragic 56.8% |
| Navajo | 0.0 /100 | #347 | Tragic 56.6% |
Demographics Similar to Spanish Americans by In Labor Force | Age > 16
In terms of in labor force | age > 16, the demographic groups most similar to Spanish Americans are Delaware (63.6%, a difference of 0.010%), White/Caucasian (63.6%, a difference of 0.030%), Immigrants from the Azores (63.6%, a difference of 0.030%), Cree (63.5%, a difference of 0.050%), and Comanche (63.6%, a difference of 0.090%).
| Demographics | Rating | Rank | In Labor Force | Age > 16 |
| Puget Sound Salish | 0.0 /100 | #294 | Tragic 63.7% |
| Immigrants | Canada | 0.0 /100 | #295 | Tragic 63.7% |
| Immigrants | North America | 0.0 /100 | #296 | Tragic 63.7% |
| Immigrants | Grenada | 0.0 /100 | #297 | Tragic 63.6% |
| Comanche | 0.0 /100 | #298 | Tragic 63.6% |
| Whites/Caucasians | 0.0 /100 | #299 | Tragic 63.6% |
| Immigrants | Azores | 0.0 /100 | #300 | Tragic 63.6% |
| Spanish Americans | 0.0 /100 | #301 | Tragic 63.6% |
| Delaware | 0.0 /100 | #302 | Tragic 63.6% |
| Cree | 0.0 /100 | #303 | Tragic 63.5% |
| Immigrants | Nonimmigrants | 0.0 /100 | #304 | Tragic 63.5% |
| Osage | 0.0 /100 | #305 | Tragic 63.5% |
| Blacks/African Americans | 0.0 /100 | #306 | Tragic 63.4% |
| Central American Indians | 0.0 /100 | #307 | Tragic 63.4% |
| Pennsylvania Germans | 0.0 /100 | #308 | Tragic 63.4% |