Croatian vs Spanish American In Labor Force | Age > 16
COMPARE
Croatian
Spanish American
In Labor Force | Age > 16
In Labor Force | Age > 16 Comparison
Croatians
Spanish Americans
64.7%
IN LABOR FORCE | AGE > 16
8.8/ 100
METRIC RATING
225th/ 347
METRIC RANK
63.6%
IN LABOR FORCE | AGE > 16
0.0/ 100
METRIC RATING
301st/ 347
METRIC RANK
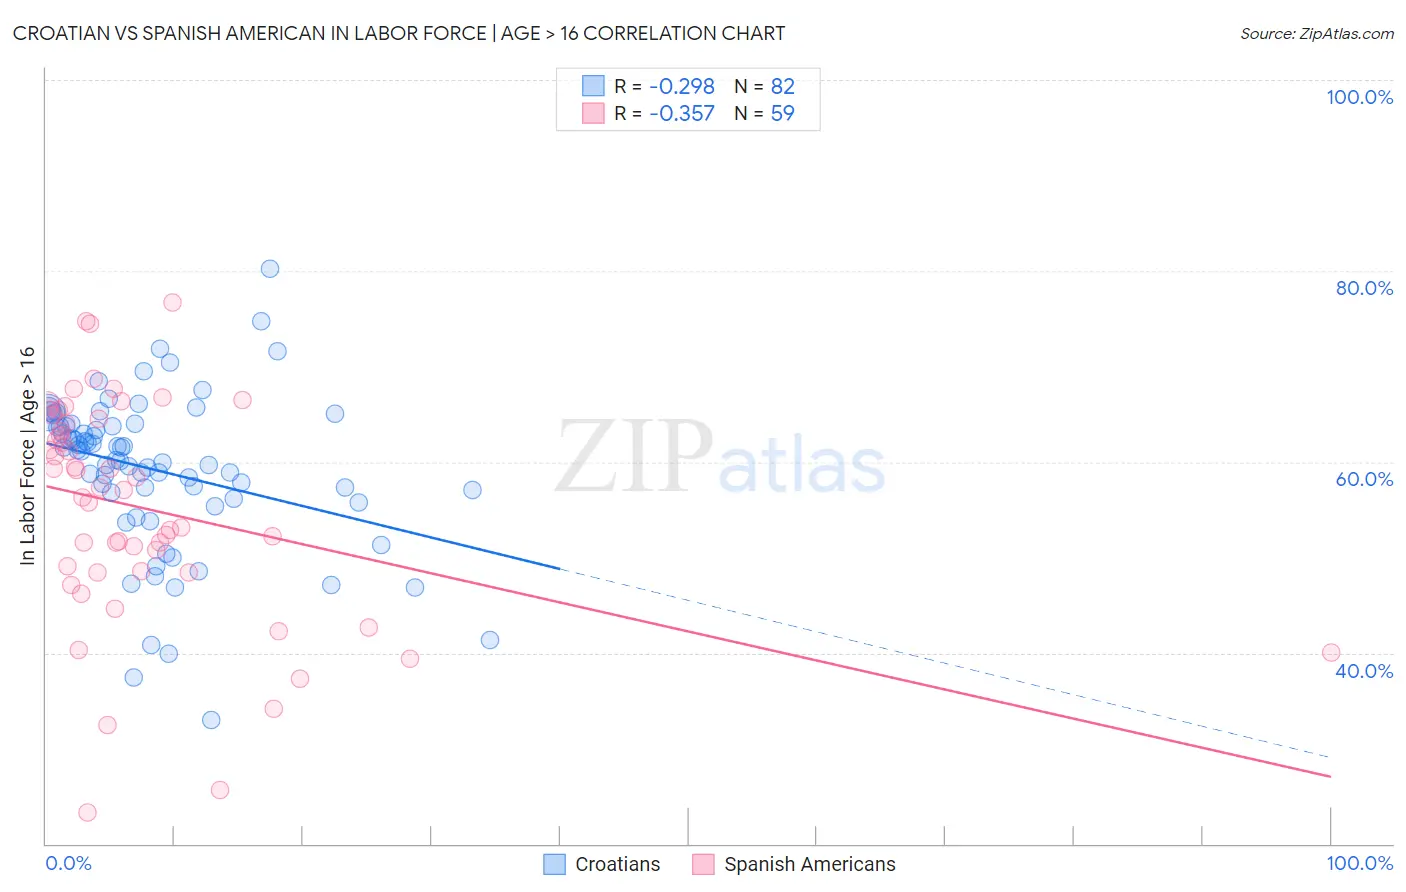
Croatian vs Spanish American In Labor Force | Age > 16 Correlation Chart
The statistical analysis conducted on geographies consisting of 375,747,004 people shows a weak negative correlation between the proportion of Croatians and labor force participation rate among population ages 16 and over in the United States with a correlation coefficient (R) of -0.298 and weighted average of 64.7%. Similarly, the statistical analysis conducted on geographies consisting of 103,168,383 people shows a mild negative correlation between the proportion of Spanish Americans and labor force participation rate among population ages 16 and over in the United States with a correlation coefficient (R) of -0.357 and weighted average of 63.6%, a difference of 1.8%.
In Labor Force | Age > 16 Correlation Summary
| Measurement | Croatian | Spanish American |
| Minimum | 33.0% | 23.3% |
| Maximum | 80.2% | 76.7% |
| Range | 47.2% | 53.4% |
| Mean | 59.1% | 55.1% |
| Median | 60.6% | 57.0% |
| Interquartile 25% (IQ1) | 56.1% | 48.4% |
| Interquartile 75% (IQ3) | 63.8% | 64.5% |
| Interquartile Range (IQR) | 7.7% | 16.1% |
| Standard Deviation (Sample) | 8.3% | 11.7% |
| Standard Deviation (Population) | 8.2% | 11.6% |
Similar Demographics by In Labor Force | Age > 16
Demographics Similar to Croatians by In Labor Force | Age > 16
In terms of in labor force | age > 16, the demographic groups most similar to Croatians are Immigrants from Jamaica (64.7%, a difference of 0.0%), Immigrants from Belize (64.7%, a difference of 0.010%), Hawaiian (64.7%, a difference of 0.020%), European (64.7%, a difference of 0.020%), and Polish (64.7%, a difference of 0.020%).
| Demographics | Rating | Rank | In Labor Force | Age > 16 |
| Alsatians | 10.7 /100 | #218 | Poor 64.7% |
| Immigrants | Central America | 10.5 /100 | #219 | Poor 64.7% |
| Alaska Natives | 9.9 /100 | #220 | Tragic 64.7% |
| Immigrants | Micronesia | 9.6 /100 | #221 | Tragic 64.7% |
| Hawaiians | 9.3 /100 | #222 | Tragic 64.7% |
| Immigrants | Belize | 9.2 /100 | #223 | Tragic 64.7% |
| Immigrants | Jamaica | 8.8 /100 | #224 | Tragic 64.7% |
| Croatians | 8.8 /100 | #225 | Tragic 64.7% |
| Europeans | 8.3 /100 | #226 | Tragic 64.7% |
| Poles | 8.3 /100 | #227 | Tragic 64.7% |
| Northern Europeans | 8.2 /100 | #228 | Tragic 64.7% |
| British | 7.3 /100 | #229 | Tragic 64.7% |
| Chinese | 7.3 /100 | #230 | Tragic 64.7% |
| Immigrants | Northern Europe | 7.2 /100 | #231 | Tragic 64.7% |
| Africans | 5.8 /100 | #232 | Tragic 64.6% |
Demographics Similar to Spanish Americans by In Labor Force | Age > 16
In terms of in labor force | age > 16, the demographic groups most similar to Spanish Americans are Delaware (63.6%, a difference of 0.010%), White/Caucasian (63.6%, a difference of 0.030%), Immigrants from the Azores (63.6%, a difference of 0.030%), Cree (63.5%, a difference of 0.050%), and Comanche (63.6%, a difference of 0.090%).
| Demographics | Rating | Rank | In Labor Force | Age > 16 |
| Puget Sound Salish | 0.0 /100 | #294 | Tragic 63.7% |
| Immigrants | Canada | 0.0 /100 | #295 | Tragic 63.7% |
| Immigrants | North America | 0.0 /100 | #296 | Tragic 63.7% |
| Immigrants | Grenada | 0.0 /100 | #297 | Tragic 63.6% |
| Comanche | 0.0 /100 | #298 | Tragic 63.6% |
| Whites/Caucasians | 0.0 /100 | #299 | Tragic 63.6% |
| Immigrants | Azores | 0.0 /100 | #300 | Tragic 63.6% |
| Spanish Americans | 0.0 /100 | #301 | Tragic 63.6% |
| Delaware | 0.0 /100 | #302 | Tragic 63.6% |
| Cree | 0.0 /100 | #303 | Tragic 63.5% |
| Immigrants | Nonimmigrants | 0.0 /100 | #304 | Tragic 63.5% |
| Osage | 0.0 /100 | #305 | Tragic 63.5% |
| Blacks/African Americans | 0.0 /100 | #306 | Tragic 63.4% |
| Central American Indians | 0.0 /100 | #307 | Tragic 63.4% |
| Pennsylvania Germans | 0.0 /100 | #308 | Tragic 63.4% |