Salvadoran vs Spanish American In Labor Force | Age > 16
COMPARE
Salvadoran
Spanish American
In Labor Force | Age > 16
In Labor Force | Age > 16 Comparison
Salvadorans
Spanish Americans
66.8%
IN LABOR FORCE | AGE > 16
100.0/ 100
METRIC RATING
39th/ 347
METRIC RANK
63.6%
IN LABOR FORCE | AGE > 16
0.0/ 100
METRIC RATING
301st/ 347
METRIC RANK
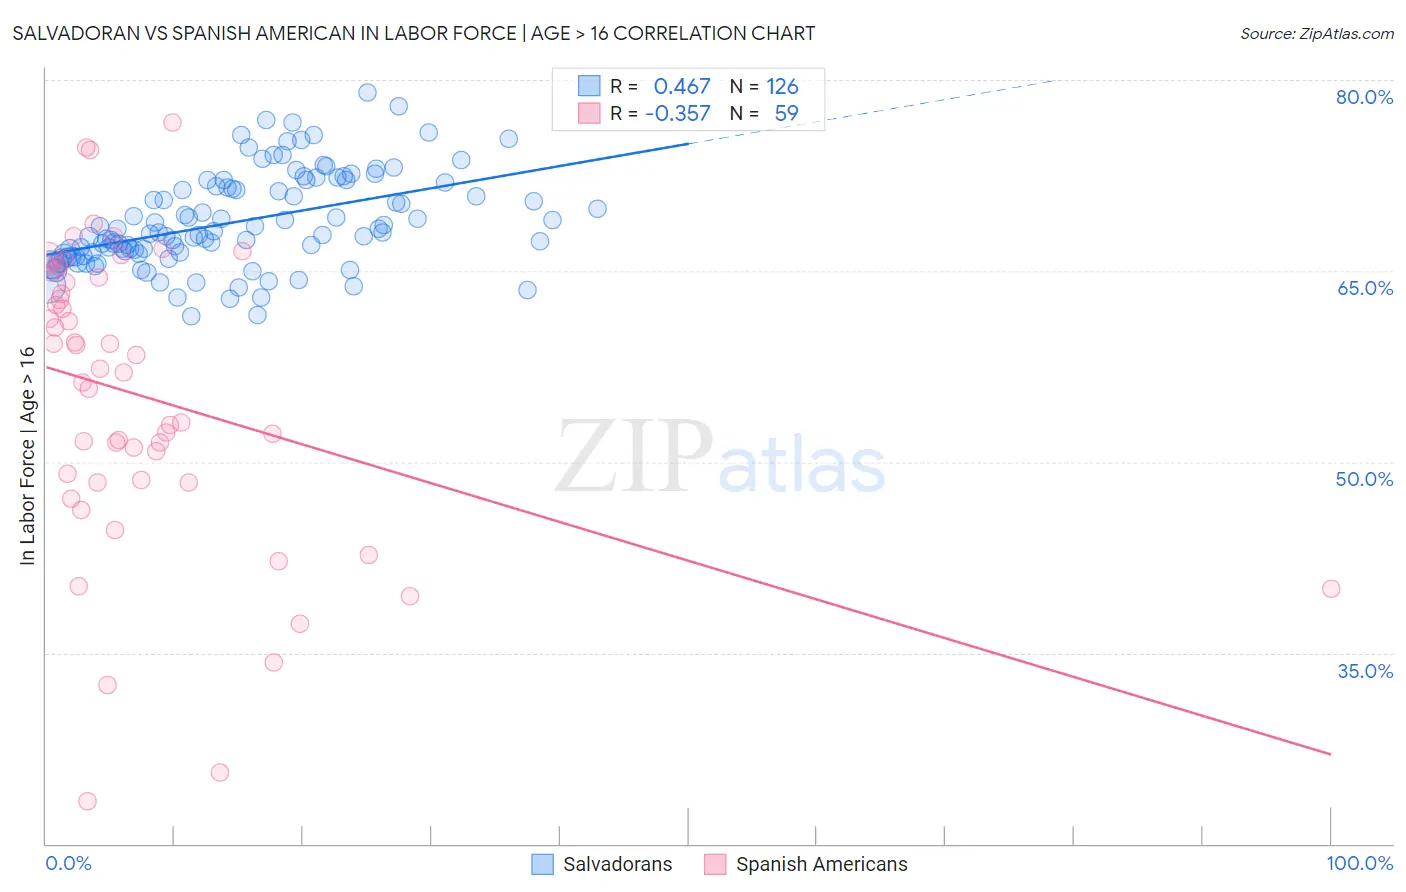
Salvadoran vs Spanish American In Labor Force | Age > 16 Correlation Chart
The statistical analysis conducted on geographies consisting of 399,019,559 people shows a moderate positive correlation between the proportion of Salvadorans and labor force participation rate among population ages 16 and over in the United States with a correlation coefficient (R) of 0.467 and weighted average of 66.8%. Similarly, the statistical analysis conducted on geographies consisting of 103,168,383 people shows a mild negative correlation between the proportion of Spanish Americans and labor force participation rate among population ages 16 and over in the United States with a correlation coefficient (R) of -0.357 and weighted average of 63.6%, a difference of 5.1%.
In Labor Force | Age > 16 Correlation Summary
| Measurement | Salvadoran | Spanish American |
| Minimum | 61.5% | 23.3% |
| Maximum | 79.0% | 76.7% |
| Range | 17.5% | 53.4% |
| Mean | 68.9% | 55.1% |
| Median | 67.9% | 57.0% |
| Interquartile 25% (IQ1) | 66.3% | 48.4% |
| Interquartile 75% (IQ3) | 71.7% | 64.5% |
| Interquartile Range (IQR) | 5.4% | 16.1% |
| Standard Deviation (Sample) | 3.7% | 11.7% |
| Standard Deviation (Population) | 3.7% | 11.6% |
Similar Demographics by In Labor Force | Age > 16
Demographics Similar to Salvadorans by In Labor Force | Age > 16
In terms of in labor force | age > 16, the demographic groups most similar to Salvadorans are Immigrants from El Salvador (66.8%, a difference of 0.020%), Immigrants from Zimbabwe (66.8%, a difference of 0.020%), Senegalese (66.7%, a difference of 0.11%), Luxembourger (66.7%, a difference of 0.14%), and Immigrants from Nigeria (66.9%, a difference of 0.16%).
| Demographics | Rating | Rank | In Labor Force | Age > 16 |
| Immigrants | Congo | 100.0 /100 | #32 | Exceptional 67.1% |
| Afghans | 100.0 /100 | #33 | Exceptional 67.1% |
| Immigrants | Ghana | 100.0 /100 | #34 | Exceptional 67.1% |
| Immigrants | South Central Asia | 100.0 /100 | #35 | Exceptional 67.1% |
| Immigrants | Western Africa | 100.0 /100 | #36 | Exceptional 67.1% |
| Immigrants | Afghanistan | 100.0 /100 | #37 | Exceptional 67.0% |
| Immigrants | Nigeria | 100.0 /100 | #38 | Exceptional 66.9% |
| Salvadorans | 100.0 /100 | #39 | Exceptional 66.8% |
| Immigrants | El Salvador | 100.0 /100 | #40 | Exceptional 66.8% |
| Immigrants | Zimbabwe | 100.0 /100 | #41 | Exceptional 66.8% |
| Senegalese | 100.0 /100 | #42 | Exceptional 66.7% |
| Luxembourgers | 100.0 /100 | #43 | Exceptional 66.7% |
| Immigrants | Pakistan | 100.0 /100 | #44 | Exceptional 66.7% |
| Immigrants | Brazil | 100.0 /100 | #45 | Exceptional 66.7% |
| Brazilians | 100.0 /100 | #46 | Exceptional 66.6% |
Demographics Similar to Spanish Americans by In Labor Force | Age > 16
In terms of in labor force | age > 16, the demographic groups most similar to Spanish Americans are Delaware (63.6%, a difference of 0.010%), White/Caucasian (63.6%, a difference of 0.030%), Immigrants from the Azores (63.6%, a difference of 0.030%), Cree (63.5%, a difference of 0.050%), and Comanche (63.6%, a difference of 0.090%).
| Demographics | Rating | Rank | In Labor Force | Age > 16 |
| Puget Sound Salish | 0.0 /100 | #294 | Tragic 63.7% |
| Immigrants | Canada | 0.0 /100 | #295 | Tragic 63.7% |
| Immigrants | North America | 0.0 /100 | #296 | Tragic 63.7% |
| Immigrants | Grenada | 0.0 /100 | #297 | Tragic 63.6% |
| Comanche | 0.0 /100 | #298 | Tragic 63.6% |
| Whites/Caucasians | 0.0 /100 | #299 | Tragic 63.6% |
| Immigrants | Azores | 0.0 /100 | #300 | Tragic 63.6% |
| Spanish Americans | 0.0 /100 | #301 | Tragic 63.6% |
| Delaware | 0.0 /100 | #302 | Tragic 63.6% |
| Cree | 0.0 /100 | #303 | Tragic 63.5% |
| Immigrants | Nonimmigrants | 0.0 /100 | #304 | Tragic 63.5% |
| Osage | 0.0 /100 | #305 | Tragic 63.5% |
| Blacks/African Americans | 0.0 /100 | #306 | Tragic 63.4% |
| Central American Indians | 0.0 /100 | #307 | Tragic 63.4% |
| Pennsylvania Germans | 0.0 /100 | #308 | Tragic 63.4% |