Immigrants from Belgium vs Immigrants from Ukraine In Labor Force | Age > 16
COMPARE
Immigrants from Belgium
Immigrants from Ukraine
In Labor Force | Age > 16
In Labor Force | Age > 16 Comparison
Immigrants from Belgium
Immigrants from Ukraine
64.9%
IN LABOR FORCE | AGE > 16
19.4/ 100
METRIC RATING
202nd/ 347
METRIC RANK
65.1%
IN LABOR FORCE | AGE > 16
53.7/ 100
METRIC RATING
173rd/ 347
METRIC RANK
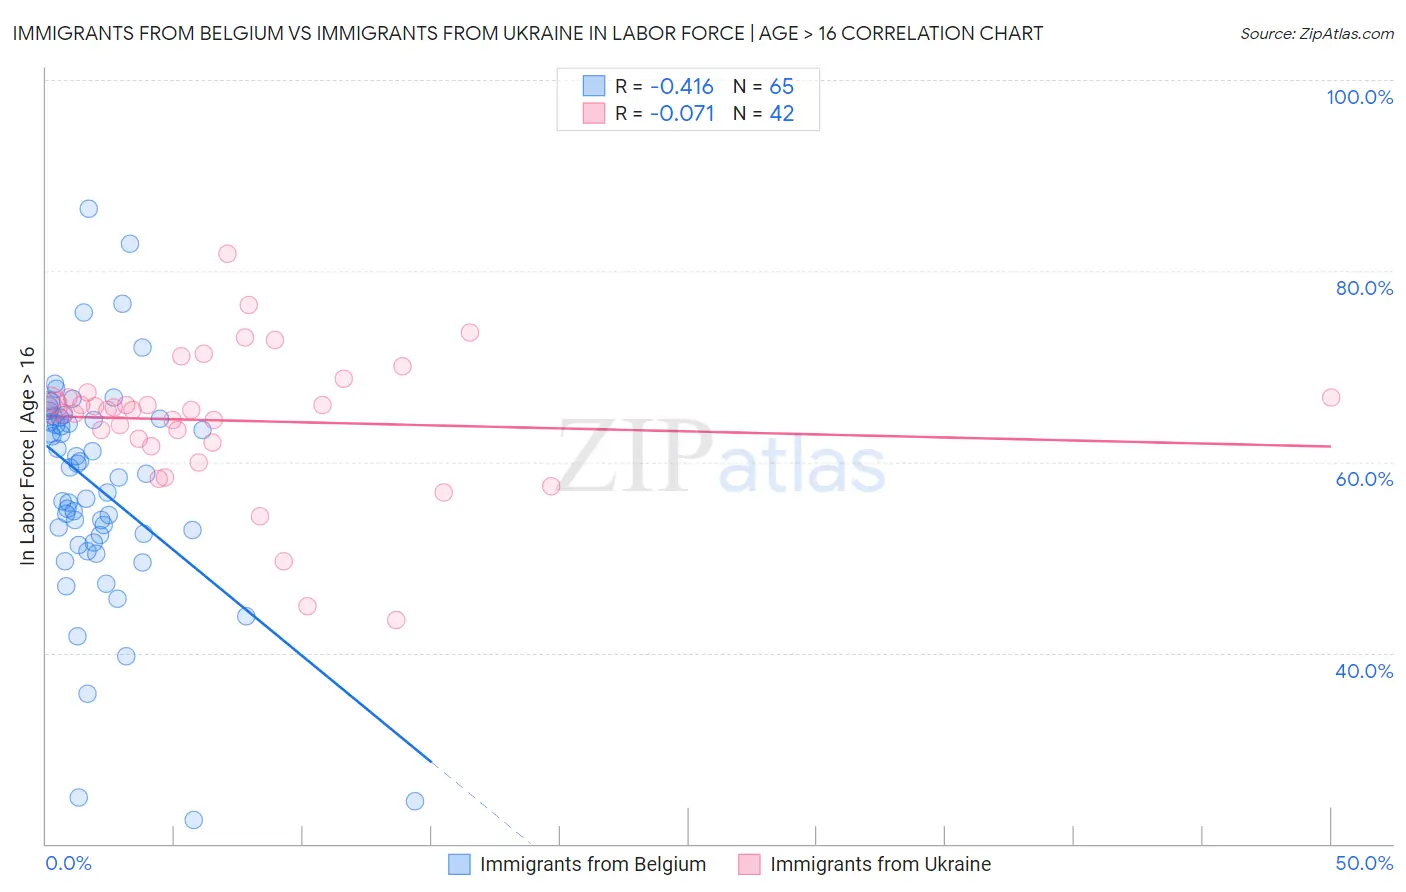
Immigrants from Belgium vs Immigrants from Ukraine In Labor Force | Age > 16 Correlation Chart
The statistical analysis conducted on geographies consisting of 146,728,908 people shows a moderate negative correlation between the proportion of Immigrants from Belgium and labor force participation rate among population ages 16 and over in the United States with a correlation coefficient (R) of -0.416 and weighted average of 64.9%. Similarly, the statistical analysis conducted on geographies consisting of 289,705,583 people shows a slight negative correlation between the proportion of Immigrants from Ukraine and labor force participation rate among population ages 16 and over in the United States with a correlation coefficient (R) of -0.071 and weighted average of 65.1%, a difference of 0.44%.
In Labor Force | Age > 16 Correlation Summary
| Measurement | Immigrants from Belgium | Immigrants from Ukraine |
| Minimum | 22.5% | 43.5% |
| Maximum | 86.5% | 81.8% |
| Range | 64.0% | 38.3% |
| Mean | 57.3% | 64.3% |
| Median | 58.8% | 65.5% |
| Interquartile 25% (IQ1) | 52.0% | 62.1% |
| Interquartile 75% (IQ3) | 64.6% | 66.8% |
| Interquartile Range (IQR) | 12.6% | 4.7% |
| Standard Deviation (Sample) | 11.9% | 7.4% |
| Standard Deviation (Population) | 11.8% | 7.3% |
Similar Demographics by In Labor Force | Age > 16
Demographics Similar to Immigrants from Belgium by In Labor Force | Age > 16
In terms of in labor force | age > 16, the demographic groups most similar to Immigrants from Belgium are Ukrainian (64.9%, a difference of 0.0%), Russian (64.9%, a difference of 0.010%), Slovene (64.9%, a difference of 0.010%), Jamaican (64.9%, a difference of 0.010%), and Armenian (64.9%, a difference of 0.020%).
| Demographics | Rating | Rank | In Labor Force | Age > 16 |
| Romanians | 31.1 /100 | #195 | Fair 65.0% |
| Haitians | 30.6 /100 | #196 | Fair 65.0% |
| Immigrants | Italy | 28.7 /100 | #197 | Fair 65.0% |
| Greeks | 26.1 /100 | #198 | Fair 64.9% |
| Mexican American Indians | 23.1 /100 | #199 | Fair 64.9% |
| Armenians | 20.2 /100 | #200 | Fair 64.9% |
| Ukrainians | 19.6 /100 | #201 | Poor 64.9% |
| Immigrants | Belgium | 19.4 /100 | #202 | Poor 64.9% |
| Russians | 18.8 /100 | #203 | Poor 64.9% |
| Slovenes | 18.7 /100 | #204 | Poor 64.9% |
| Jamaicans | 18.7 /100 | #205 | Poor 64.9% |
| Lithuanians | 17.4 /100 | #206 | Poor 64.8% |
| Immigrants | Latin America | 16.4 /100 | #207 | Poor 64.8% |
| Belizeans | 16.2 /100 | #208 | Poor 64.8% |
| Immigrants | Trinidad and Tobago | 15.6 /100 | #209 | Poor 64.8% |
Demographics Similar to Immigrants from Ukraine by In Labor Force | Age > 16
In terms of in labor force | age > 16, the demographic groups most similar to Immigrants from Ukraine are Macedonian (65.1%, a difference of 0.040%), Nicaraguan (65.1%, a difference of 0.040%), Swedish (65.1%, a difference of 0.070%), Eastern European (65.1%, a difference of 0.080%), and Immigrants from Israel (65.2%, a difference of 0.090%).
| Demographics | Rating | Rank | In Labor Force | Age > 16 |
| Immigrants | Western Asia | 67.3 /100 | #166 | Good 65.3% |
| Immigrants | Belarus | 66.0 /100 | #167 | Good 65.2% |
| Serbians | 63.5 /100 | #168 | Good 65.2% |
| Arabs | 62.4 /100 | #169 | Good 65.2% |
| Immigrants | Israel | 61.7 /100 | #170 | Good 65.2% |
| Israelis | 61.6 /100 | #171 | Good 65.2% |
| Immigrants | Sweden | 61.3 /100 | #172 | Good 65.2% |
| Immigrants | Ukraine | 53.7 /100 | #173 | Average 65.1% |
| Macedonians | 50.0 /100 | #174 | Average 65.1% |
| Nicaraguans | 49.7 /100 | #175 | Average 65.1% |
| Swedes | 47.4 /100 | #176 | Average 65.1% |
| Eastern Europeans | 46.2 /100 | #177 | Average 65.1% |
| Trinidadians and Tobagonians | 45.2 /100 | #178 | Average 65.1% |
| Immigrants | Haiti | 43.3 /100 | #179 | Average 65.1% |
| Immigrants | Latvia | 42.9 /100 | #180 | Average 65.1% |