Immigrants from Afghanistan vs Immigrants from Ukraine In Labor Force | Age > 16
COMPARE
Immigrants from Afghanistan
Immigrants from Ukraine
In Labor Force | Age > 16
In Labor Force | Age > 16 Comparison
Immigrants from Afghanistan
Immigrants from Ukraine
67.0%
IN LABOR FORCE | AGE > 16
100.0/ 100
METRIC RATING
37th/ 347
METRIC RANK
65.1%
IN LABOR FORCE | AGE > 16
53.7/ 100
METRIC RATING
173rd/ 347
METRIC RANK
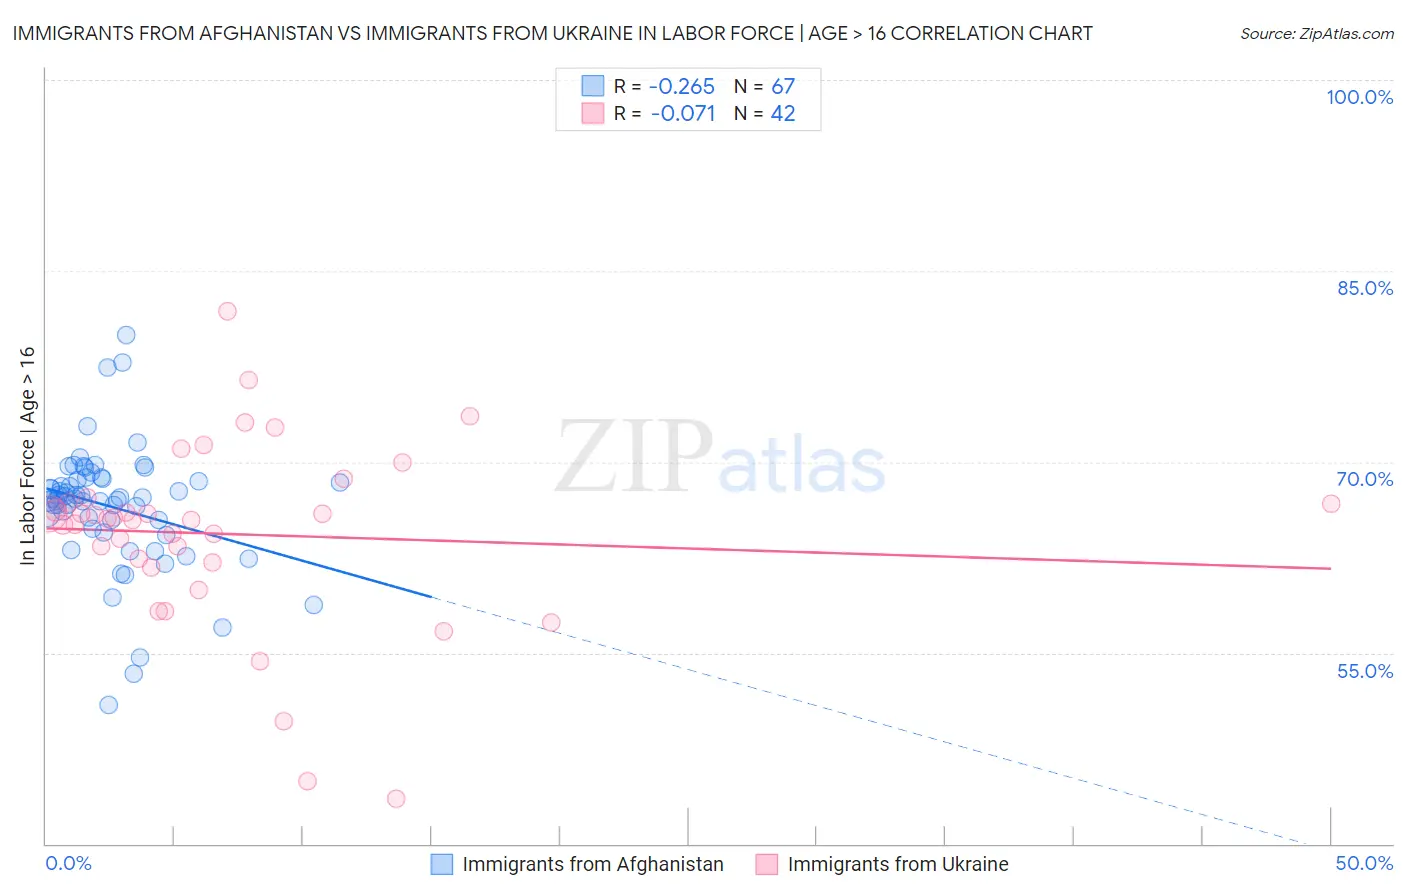
Immigrants from Afghanistan vs Immigrants from Ukraine In Labor Force | Age > 16 Correlation Chart
The statistical analysis conducted on geographies consisting of 147,646,039 people shows a weak negative correlation between the proportion of Immigrants from Afghanistan and labor force participation rate among population ages 16 and over in the United States with a correlation coefficient (R) of -0.265 and weighted average of 67.0%. Similarly, the statistical analysis conducted on geographies consisting of 289,705,583 people shows a slight negative correlation between the proportion of Immigrants from Ukraine and labor force participation rate among population ages 16 and over in the United States with a correlation coefficient (R) of -0.071 and weighted average of 65.1%, a difference of 2.9%.
In Labor Force | Age > 16 Correlation Summary
| Measurement | Immigrants from Afghanistan | Immigrants from Ukraine |
| Minimum | 50.9% | 43.5% |
| Maximum | 80.0% | 81.8% |
| Range | 29.1% | 38.3% |
| Mean | 66.5% | 64.3% |
| Median | 67.1% | 65.5% |
| Interquartile 25% (IQ1) | 64.7% | 62.1% |
| Interquartile 75% (IQ3) | 68.7% | 66.8% |
| Interquartile Range (IQR) | 4.0% | 4.7% |
| Standard Deviation (Sample) | 4.8% | 7.4% |
| Standard Deviation (Population) | 4.8% | 7.3% |
Similar Demographics by In Labor Force | Age > 16
Demographics Similar to Immigrants from Afghanistan by In Labor Force | Age > 16
In terms of in labor force | age > 16, the demographic groups most similar to Immigrants from Afghanistan are Immigrants from South Central Asia (67.1%, a difference of 0.080%), Immigrants from Western Africa (67.1%, a difference of 0.080%), Immigrants from Nigeria (66.9%, a difference of 0.12%), Immigrants from Ghana (67.1%, a difference of 0.13%), and Immigrants from Congo (67.1%, a difference of 0.14%).
| Demographics | Rating | Rank | In Labor Force | Age > 16 |
| Immigrants | Zaire | 100.0 /100 | #30 | Exceptional 67.2% |
| Ghanaians | 100.0 /100 | #31 | Exceptional 67.1% |
| Immigrants | Congo | 100.0 /100 | #32 | Exceptional 67.1% |
| Afghans | 100.0 /100 | #33 | Exceptional 67.1% |
| Immigrants | Ghana | 100.0 /100 | #34 | Exceptional 67.1% |
| Immigrants | South Central Asia | 100.0 /100 | #35 | Exceptional 67.1% |
| Immigrants | Western Africa | 100.0 /100 | #36 | Exceptional 67.1% |
| Immigrants | Afghanistan | 100.0 /100 | #37 | Exceptional 67.0% |
| Immigrants | Nigeria | 100.0 /100 | #38 | Exceptional 66.9% |
| Salvadorans | 100.0 /100 | #39 | Exceptional 66.8% |
| Immigrants | El Salvador | 100.0 /100 | #40 | Exceptional 66.8% |
| Immigrants | Zimbabwe | 100.0 /100 | #41 | Exceptional 66.8% |
| Senegalese | 100.0 /100 | #42 | Exceptional 66.7% |
| Luxembourgers | 100.0 /100 | #43 | Exceptional 66.7% |
| Immigrants | Pakistan | 100.0 /100 | #44 | Exceptional 66.7% |
Demographics Similar to Immigrants from Ukraine by In Labor Force | Age > 16
In terms of in labor force | age > 16, the demographic groups most similar to Immigrants from Ukraine are Macedonian (65.1%, a difference of 0.040%), Nicaraguan (65.1%, a difference of 0.040%), Swedish (65.1%, a difference of 0.070%), Eastern European (65.1%, a difference of 0.080%), and Immigrants from Israel (65.2%, a difference of 0.090%).
| Demographics | Rating | Rank | In Labor Force | Age > 16 |
| Immigrants | Western Asia | 67.3 /100 | #166 | Good 65.3% |
| Immigrants | Belarus | 66.0 /100 | #167 | Good 65.2% |
| Serbians | 63.5 /100 | #168 | Good 65.2% |
| Arabs | 62.4 /100 | #169 | Good 65.2% |
| Immigrants | Israel | 61.7 /100 | #170 | Good 65.2% |
| Israelis | 61.6 /100 | #171 | Good 65.2% |
| Immigrants | Sweden | 61.3 /100 | #172 | Good 65.2% |
| Immigrants | Ukraine | 53.7 /100 | #173 | Average 65.1% |
| Macedonians | 50.0 /100 | #174 | Average 65.1% |
| Nicaraguans | 49.7 /100 | #175 | Average 65.1% |
| Swedes | 47.4 /100 | #176 | Average 65.1% |
| Eastern Europeans | 46.2 /100 | #177 | Average 65.1% |
| Trinidadians and Tobagonians | 45.2 /100 | #178 | Average 65.1% |
| Immigrants | Haiti | 43.3 /100 | #179 | Average 65.1% |
| Immigrants | Latvia | 42.9 /100 | #180 | Average 65.1% |