Yugoslavian vs Immigrants from Ukraine Median Female Earnings
COMPARE
Yugoslavian
Immigrants from Ukraine
Median Female Earnings
Median Female Earnings Comparison
Yugoslavians
Immigrants from Ukraine
$38,573
MEDIAN FEMALE EARNINGS
8.8/ 100
METRIC RATING
220th/ 347
METRIC RANK
$43,069
MEDIAN FEMALE EARNINGS
99.9/ 100
METRIC RATING
63rd/ 347
METRIC RANK
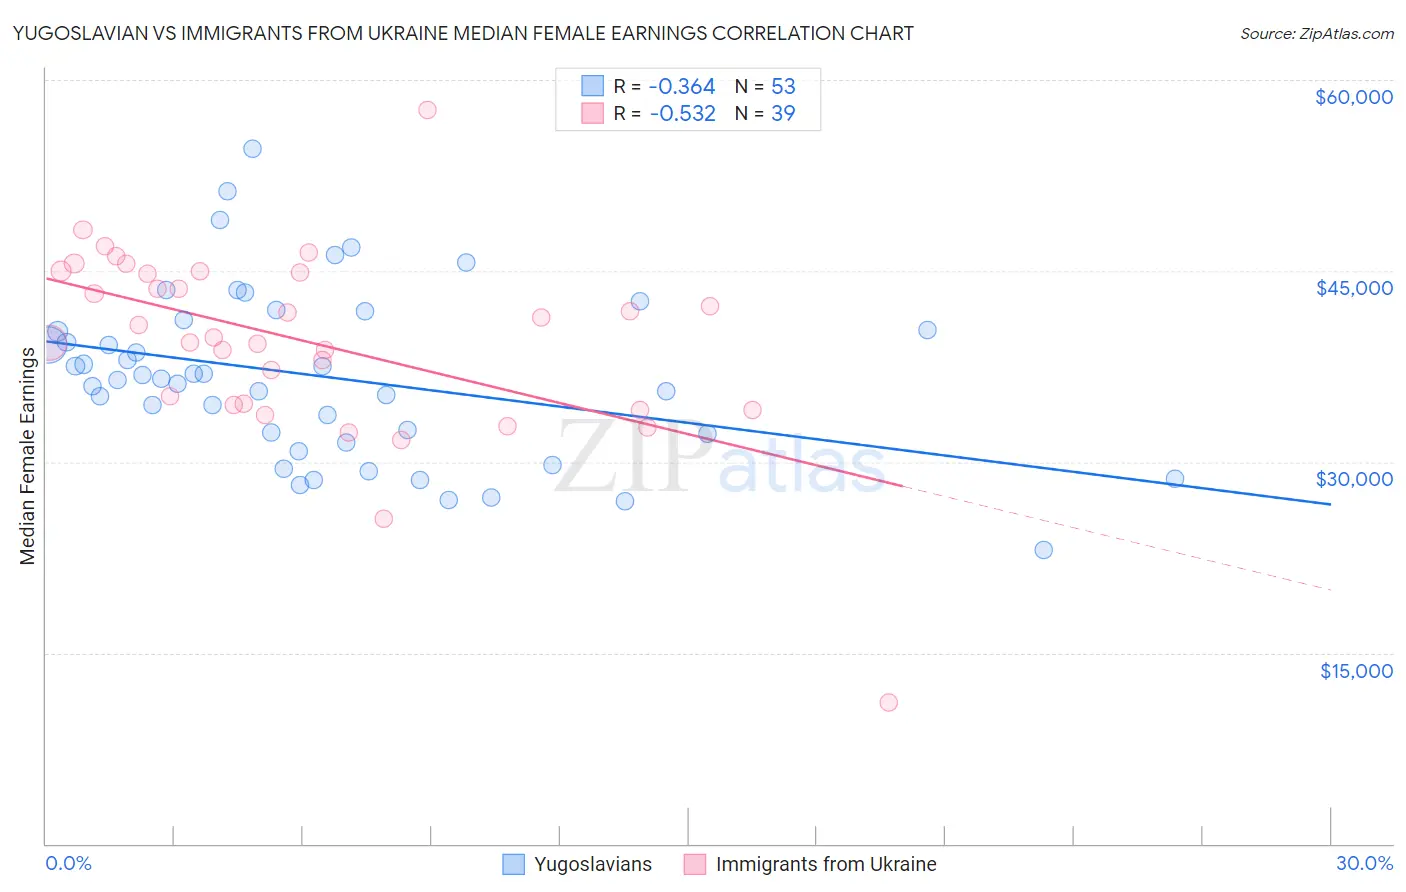
Yugoslavian vs Immigrants from Ukraine Median Female Earnings Correlation Chart
The statistical analysis conducted on geographies consisting of 285,638,776 people shows a mild negative correlation between the proportion of Yugoslavians and median female earnings in the United States with a correlation coefficient (R) of -0.364 and weighted average of $38,573. Similarly, the statistical analysis conducted on geographies consisting of 289,632,492 people shows a substantial negative correlation between the proportion of Immigrants from Ukraine and median female earnings in the United States with a correlation coefficient (R) of -0.532 and weighted average of $43,069, a difference of 11.7%.
Median Female Earnings Correlation Summary
| Measurement | Yugoslavian | Immigrants from Ukraine |
| Minimum | $23,125 | $11,071 |
| Maximum | $54,556 | $57,684 |
| Range | $31,431 | $46,613 |
| Mean | $36,696 | $39,415 |
| Median | $36,579 | $39,738 |
| Interquartile 25% (IQ1) | $31,882 | $34,500 |
| Interquartile 75% (IQ3) | $40,715 | $44,923 |
| Interquartile Range (IQR) | $8,834 | $10,424 |
| Standard Deviation (Sample) | $6,632 | $7,597 |
| Standard Deviation (Population) | $6,570 | $7,499 |
Similar Demographics by Median Female Earnings
Demographics Similar to Yugoslavians by Median Female Earnings
In terms of median female earnings, the demographic groups most similar to Yugoslavians are Immigrants from the Azores ($38,573, a difference of 0.0%), Nepalese ($38,603, a difference of 0.080%), Cape Verdean ($38,614, a difference of 0.11%), Japanese ($38,528, a difference of 0.12%), and Immigrants from Jamaica ($38,625, a difference of 0.14%).
| Demographics | Rating | Rank | Median Female Earnings |
| Jamaicans | 10.5 /100 | #213 | Poor $38,670 |
| Iraqis | 10.5 /100 | #214 | Poor $38,666 |
| Spaniards | 10.3 /100 | #215 | Poor $38,656 |
| Immigrants | Ecuador | 10.1 /100 | #216 | Poor $38,644 |
| Immigrants | Jamaica | 9.7 /100 | #217 | Tragic $38,625 |
| Cape Verdeans | 9.5 /100 | #218 | Tragic $38,614 |
| Nepalese | 9.3 /100 | #219 | Tragic $38,603 |
| Yugoslavians | 8.8 /100 | #220 | Tragic $38,573 |
| Immigrants | Azores | 8.8 /100 | #221 | Tragic $38,573 |
| Japanese | 8.1 /100 | #222 | Tragic $38,528 |
| Immigrants | Sudan | 7.8 /100 | #223 | Tragic $38,511 |
| Native Hawaiians | 7.1 /100 | #224 | Tragic $38,461 |
| French | 7.0 /100 | #225 | Tragic $38,457 |
| French Canadians | 6.8 /100 | #226 | Tragic $38,436 |
| Scottish | 6.3 /100 | #227 | Tragic $38,397 |
Demographics Similar to Immigrants from Ukraine by Median Female Earnings
In terms of median female earnings, the demographic groups most similar to Immigrants from Ukraine are Afghan ($43,077, a difference of 0.020%), Immigrants from Bulgaria ($43,085, a difference of 0.040%), Immigrants from Pakistan ($43,052, a difference of 0.040%), Immigrants from Latvia ($43,099, a difference of 0.070%), and Estonian ($43,106, a difference of 0.090%).
| Demographics | Rating | Rank | Median Female Earnings |
| Immigrants | Croatia | 99.9 /100 | #56 | Exceptional $43,258 |
| Ethiopians | 99.9 /100 | #57 | Exceptional $43,243 |
| Paraguayans | 99.9 /100 | #58 | Exceptional $43,173 |
| Estonians | 99.9 /100 | #59 | Exceptional $43,106 |
| Immigrants | Latvia | 99.9 /100 | #60 | Exceptional $43,099 |
| Immigrants | Bulgaria | 99.9 /100 | #61 | Exceptional $43,085 |
| Afghans | 99.9 /100 | #62 | Exceptional $43,077 |
| Immigrants | Ukraine | 99.9 /100 | #63 | Exceptional $43,069 |
| Immigrants | Pakistan | 99.9 /100 | #64 | Exceptional $43,052 |
| Sierra Leoneans | 99.9 /100 | #65 | Exceptional $42,868 |
| Immigrants | Norway | 99.9 /100 | #66 | Exceptional $42,837 |
| Immigrants | Egypt | 99.9 /100 | #67 | Exceptional $42,837 |
| Immigrants | Austria | 99.8 /100 | #68 | Exceptional $42,824 |
| Immigrants | Spain | 99.8 /100 | #69 | Exceptional $42,815 |
| Immigrants | Ethiopia | 99.8 /100 | #70 | Exceptional $42,744 |