Paiute vs Immigrants from Bosnia and Herzegovina In Labor Force | Age > 16
COMPARE
Paiute
Immigrants from Bosnia and Herzegovina
In Labor Force | Age > 16
In Labor Force | Age > 16 Comparison
Paiute
Immigrants from Bosnia and Herzegovina
60.7%
IN LABOR FORCE | AGE > 16
0.0/ 100
METRIC RATING
333rd/ 347
METRIC RANK
66.5%
IN LABOR FORCE | AGE > 16
99.9/ 100
METRIC RATING
54th/ 347
METRIC RANK
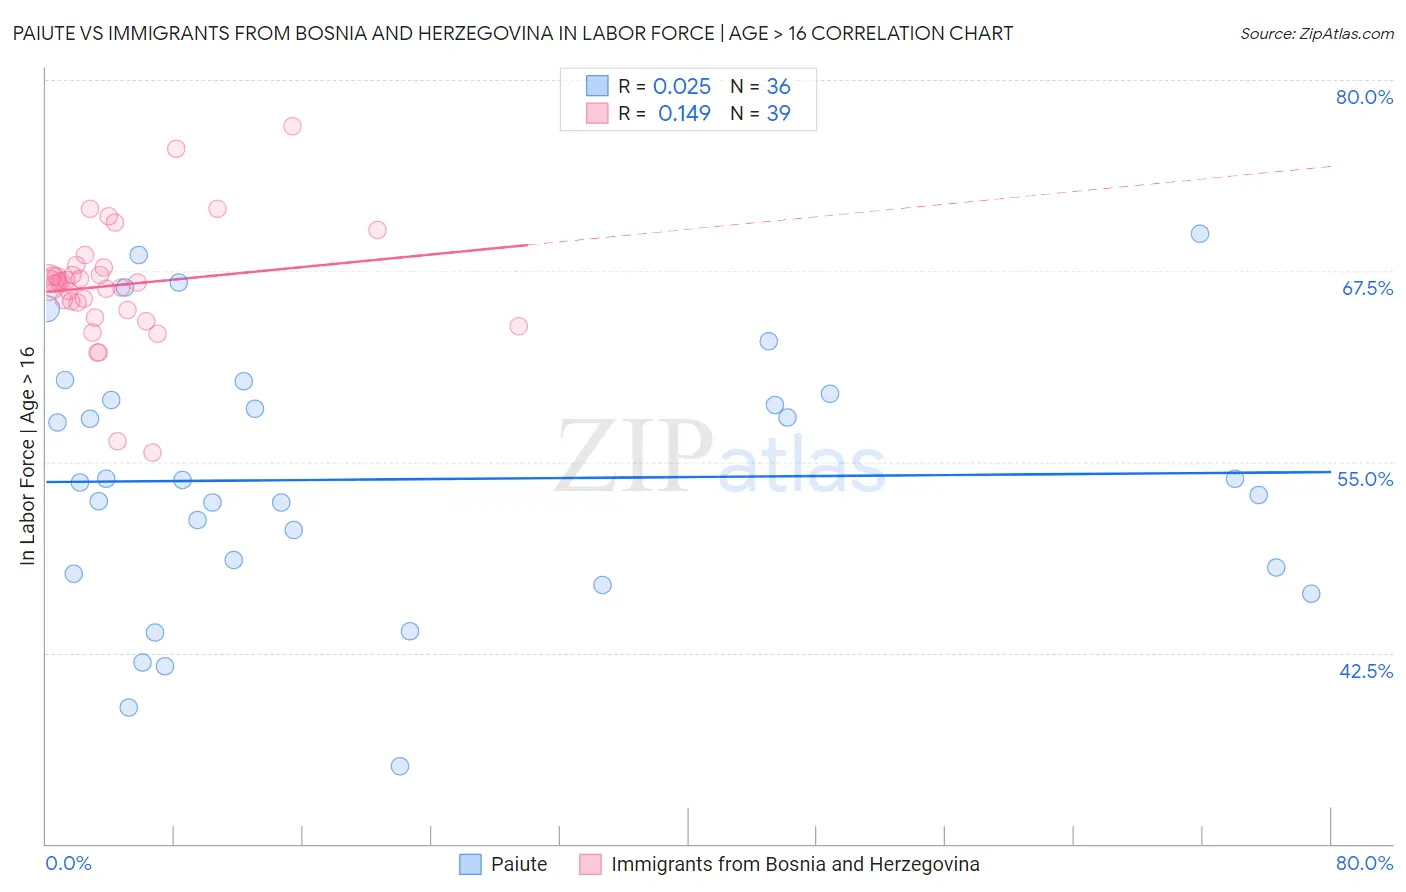
Paiute vs Immigrants from Bosnia and Herzegovina In Labor Force | Age > 16 Correlation Chart
The statistical analysis conducted on geographies consisting of 58,401,251 people shows no correlation between the proportion of Paiute and labor force participation rate among population ages 16 and over in the United States with a correlation coefficient (R) of 0.025 and weighted average of 60.7%. Similarly, the statistical analysis conducted on geographies consisting of 156,819,568 people shows a poor positive correlation between the proportion of Immigrants from Bosnia and Herzegovina and labor force participation rate among population ages 16 and over in the United States with a correlation coefficient (R) of 0.149 and weighted average of 66.5%, a difference of 9.4%.
In Labor Force | Age > 16 Correlation Summary
| Measurement | Paiute | Immigrants from Bosnia and Herzegovina |
| Minimum | 35.1% | 55.6% |
| Maximum | 69.9% | 77.0% |
| Range | 34.8% | 21.4% |
| Mean | 53.9% | 66.6% |
| Median | 53.7% | 66.8% |
| Interquartile 25% (IQ1) | 47.9% | 65.0% |
| Interquartile 75% (IQ3) | 59.2% | 67.7% |
| Interquartile Range (IQR) | 11.4% | 2.8% |
| Standard Deviation (Sample) | 8.5% | 4.0% |
| Standard Deviation (Population) | 8.4% | 3.9% |
Similar Demographics by In Labor Force | Age > 16
Demographics Similar to Paiute by In Labor Force | Age > 16
In terms of in labor force | age > 16, the demographic groups most similar to Paiute are Apache (60.7%, a difference of 0.050%), Crow (60.8%, a difference of 0.080%), Native/Alaskan (60.6%, a difference of 0.23%), Ute (60.9%, a difference of 0.26%), and Menominee (60.6%, a difference of 0.26%).
| Demographics | Rating | Rank | In Labor Force | Age > 16 |
| Sioux | 0.0 /100 | #326 | Tragic 61.8% |
| Cajuns | 0.0 /100 | #327 | Tragic 61.8% |
| Dutch West Indians | 0.0 /100 | #328 | Tragic 61.7% |
| Choctaw | 0.0 /100 | #329 | Tragic 61.5% |
| Creek | 0.0 /100 | #330 | Tragic 61.3% |
| Ute | 0.0 /100 | #331 | Tragic 60.9% |
| Crow | 0.0 /100 | #332 | Tragic 60.8% |
| Paiute | 0.0 /100 | #333 | Tragic 60.7% |
| Apache | 0.0 /100 | #334 | Tragic 60.7% |
| Natives/Alaskans | 0.0 /100 | #335 | Tragic 60.6% |
| Menominee | 0.0 /100 | #336 | Tragic 60.6% |
| Colville | 0.0 /100 | #337 | Tragic 59.8% |
| Immigrants | Yemen | 0.0 /100 | #338 | Tragic 59.6% |
| Houma | 0.0 /100 | #339 | Tragic 59.5% |
| Pueblo | 0.0 /100 | #340 | Tragic 59.3% |
Demographics Similar to Immigrants from Bosnia and Herzegovina by In Labor Force | Age > 16
In terms of in labor force | age > 16, the demographic groups most similar to Immigrants from Bosnia and Herzegovina are Immigrants from Sri Lanka (66.5%, a difference of 0.030%), Paraguayan (66.5%, a difference of 0.050%), Immigrants from Venezuela (66.4%, a difference of 0.050%), Immigrants from Kuwait (66.5%, a difference of 0.080%), and Immigrants from Senegal (66.4%, a difference of 0.080%).
| Demographics | Rating | Rank | In Labor Force | Age > 16 |
| Immigrants | Bulgaria | 100.0 /100 | #47 | Exceptional 66.6% |
| Nigerians | 100.0 /100 | #48 | Exceptional 66.6% |
| Immigrants | Northern Africa | 100.0 /100 | #49 | Exceptional 66.6% |
| Cape Verdeans | 100.0 /100 | #50 | Exceptional 66.6% |
| Immigrants | Kuwait | 100.0 /100 | #51 | Exceptional 66.5% |
| Paraguayans | 99.9 /100 | #52 | Exceptional 66.5% |
| Immigrants | Sri Lanka | 99.9 /100 | #53 | Exceptional 66.5% |
| Immigrants | Bosnia and Herzegovina | 99.9 /100 | #54 | Exceptional 66.5% |
| Immigrants | Venezuela | 99.9 /100 | #55 | Exceptional 66.4% |
| Immigrants | Senegal | 99.9 /100 | #56 | Exceptional 66.4% |
| Bulgarians | 99.9 /100 | #57 | Exceptional 66.4% |
| Immigrants | Saudi Arabia | 99.9 /100 | #58 | Exceptional 66.3% |
| Immigrants | Turkey | 99.9 /100 | #59 | Exceptional 66.3% |
| Immigrants | Peru | 99.8 /100 | #60 | Exceptional 66.3% |
| Immigrants | Burma/Myanmar | 99.8 /100 | #61 | Exceptional 66.3% |