Danish vs Immigrants from Bosnia and Herzegovina In Labor Force | Age > 16
COMPARE
Danish
Immigrants from Bosnia and Herzegovina
In Labor Force | Age > 16
In Labor Force | Age > 16 Comparison
Danes
Immigrants from Bosnia and Herzegovina
65.3%
IN LABOR FORCE | AGE > 16
68.8/ 100
METRIC RATING
164th/ 347
METRIC RANK
66.5%
IN LABOR FORCE | AGE > 16
99.9/ 100
METRIC RATING
54th/ 347
METRIC RANK
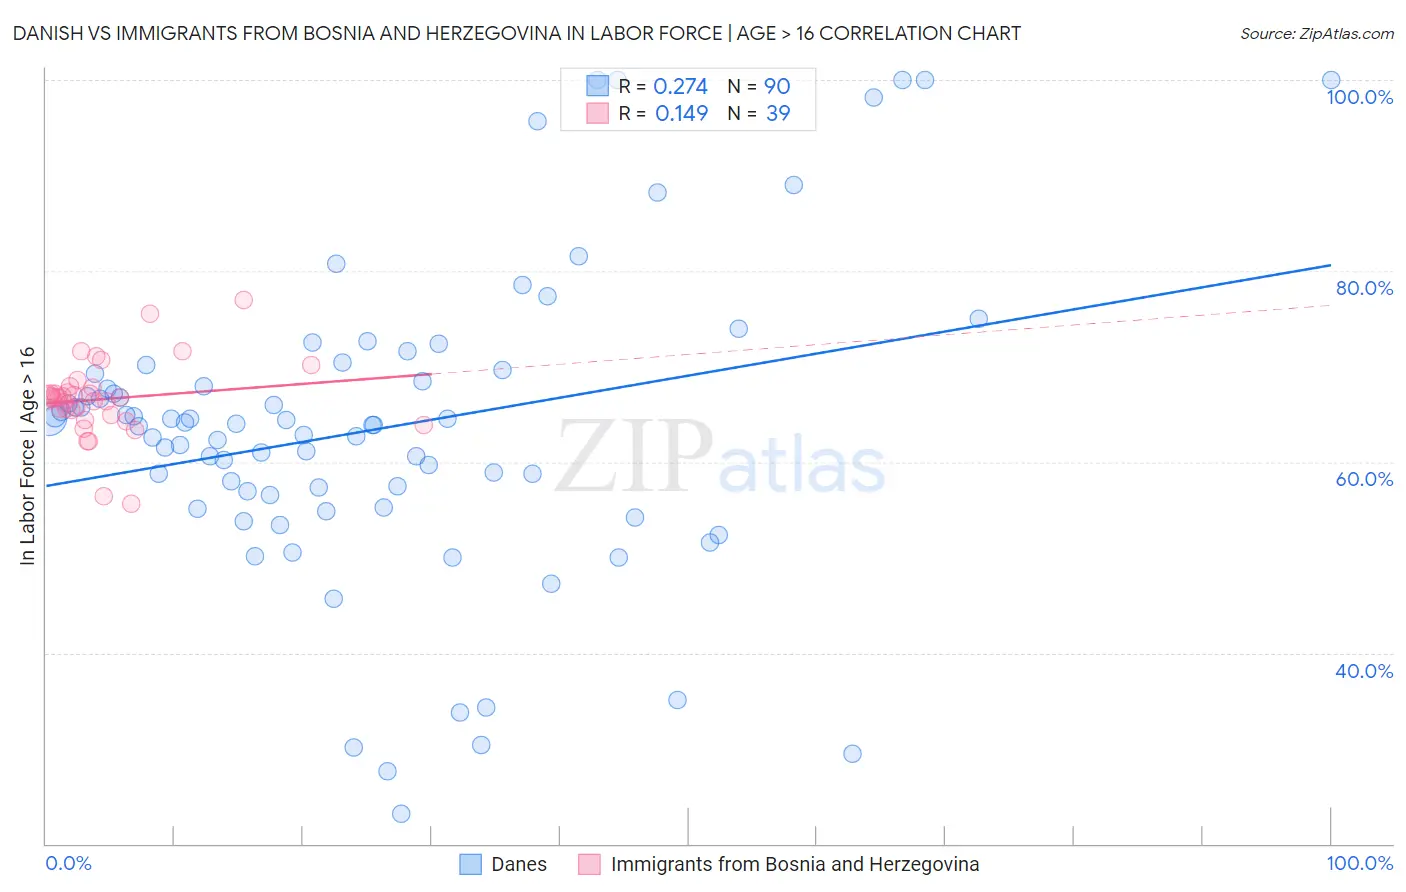
Danish vs Immigrants from Bosnia and Herzegovina In Labor Force | Age > 16 Correlation Chart
The statistical analysis conducted on geographies consisting of 474,191,872 people shows a weak positive correlation between the proportion of Danes and labor force participation rate among population ages 16 and over in the United States with a correlation coefficient (R) of 0.274 and weighted average of 65.3%. Similarly, the statistical analysis conducted on geographies consisting of 156,819,568 people shows a poor positive correlation between the proportion of Immigrants from Bosnia and Herzegovina and labor force participation rate among population ages 16 and over in the United States with a correlation coefficient (R) of 0.149 and weighted average of 66.5%, a difference of 1.8%.
In Labor Force | Age > 16 Correlation Summary
| Measurement | Danish | Immigrants from Bosnia and Herzegovina |
| Minimum | 23.1% | 55.6% |
| Maximum | 100.0% | 77.0% |
| Range | 76.9% | 21.4% |
| Mean | 63.4% | 66.6% |
| Median | 63.9% | 66.8% |
| Interquartile 25% (IQ1) | 56.6% | 65.0% |
| Interquartile 75% (IQ3) | 69.2% | 67.7% |
| Interquartile Range (IQR) | 12.7% | 2.8% |
| Standard Deviation (Sample) | 16.2% | 4.0% |
| Standard Deviation (Population) | 16.1% | 3.9% |
Similar Demographics by In Labor Force | Age > 16
Demographics Similar to Danes by In Labor Force | Age > 16
In terms of in labor force | age > 16, the demographic groups most similar to Danes are South African (65.3%, a difference of 0.010%), Immigrants from Kazakhstan (65.3%, a difference of 0.010%), Immigrants from Western Asia (65.3%, a difference of 0.020%), Australian (65.3%, a difference of 0.030%), and Albanian (65.3%, a difference of 0.030%).
| Demographics | Rating | Rank | In Labor Force | Age > 16 |
| Immigrants | Russia | 75.7 /100 | #157 | Good 65.3% |
| Panamanians | 75.2 /100 | #158 | Good 65.3% |
| Immigrants | Syria | 74.6 /100 | #159 | Good 65.3% |
| Immigrants | South Africa | 73.5 /100 | #160 | Good 65.3% |
| Australians | 71.3 /100 | #161 | Good 65.3% |
| Albanians | 70.8 /100 | #162 | Good 65.3% |
| South Africans | 69.8 /100 | #163 | Good 65.3% |
| Danes | 68.8 /100 | #164 | Good 65.3% |
| Immigrants | Kazakhstan | 68.1 /100 | #165 | Good 65.3% |
| Immigrants | Western Asia | 67.3 /100 | #166 | Good 65.3% |
| Immigrants | Belarus | 66.0 /100 | #167 | Good 65.2% |
| Serbians | 63.5 /100 | #168 | Good 65.2% |
| Arabs | 62.4 /100 | #169 | Good 65.2% |
| Immigrants | Israel | 61.7 /100 | #170 | Good 65.2% |
| Israelis | 61.6 /100 | #171 | Good 65.2% |
Demographics Similar to Immigrants from Bosnia and Herzegovina by In Labor Force | Age > 16
In terms of in labor force | age > 16, the demographic groups most similar to Immigrants from Bosnia and Herzegovina are Immigrants from Sri Lanka (66.5%, a difference of 0.030%), Paraguayan (66.5%, a difference of 0.050%), Immigrants from Venezuela (66.4%, a difference of 0.050%), Immigrants from Kuwait (66.5%, a difference of 0.080%), and Immigrants from Senegal (66.4%, a difference of 0.080%).
| Demographics | Rating | Rank | In Labor Force | Age > 16 |
| Immigrants | Bulgaria | 100.0 /100 | #47 | Exceptional 66.6% |
| Nigerians | 100.0 /100 | #48 | Exceptional 66.6% |
| Immigrants | Northern Africa | 100.0 /100 | #49 | Exceptional 66.6% |
| Cape Verdeans | 100.0 /100 | #50 | Exceptional 66.6% |
| Immigrants | Kuwait | 100.0 /100 | #51 | Exceptional 66.5% |
| Paraguayans | 99.9 /100 | #52 | Exceptional 66.5% |
| Immigrants | Sri Lanka | 99.9 /100 | #53 | Exceptional 66.5% |
| Immigrants | Bosnia and Herzegovina | 99.9 /100 | #54 | Exceptional 66.5% |
| Immigrants | Venezuela | 99.9 /100 | #55 | Exceptional 66.4% |
| Immigrants | Senegal | 99.9 /100 | #56 | Exceptional 66.4% |
| Bulgarians | 99.9 /100 | #57 | Exceptional 66.4% |
| Immigrants | Saudi Arabia | 99.9 /100 | #58 | Exceptional 66.3% |
| Immigrants | Turkey | 99.9 /100 | #59 | Exceptional 66.3% |
| Immigrants | Peru | 99.8 /100 | #60 | Exceptional 66.3% |
| Immigrants | Burma/Myanmar | 99.8 /100 | #61 | Exceptional 66.3% |