Yugoslavian vs Immigrants from Bosnia and Herzegovina Householder Income Ages 25 - 44 years
COMPARE
Yugoslavian
Immigrants from Bosnia and Herzegovina
Householder Income Ages 25 - 44 years
Householder Income Ages 25 - 44 years Comparison
Yugoslavians
Immigrants from Bosnia and Herzegovina
$91,368
HOUSEHOLDER INCOME AGES 25 - 44 YEARS
14.5/ 100
METRIC RATING
207th/ 347
METRIC RANK
$88,819
HOUSEHOLDER INCOME AGES 25 - 44 YEARS
4.0/ 100
METRIC RATING
228th/ 347
METRIC RANK
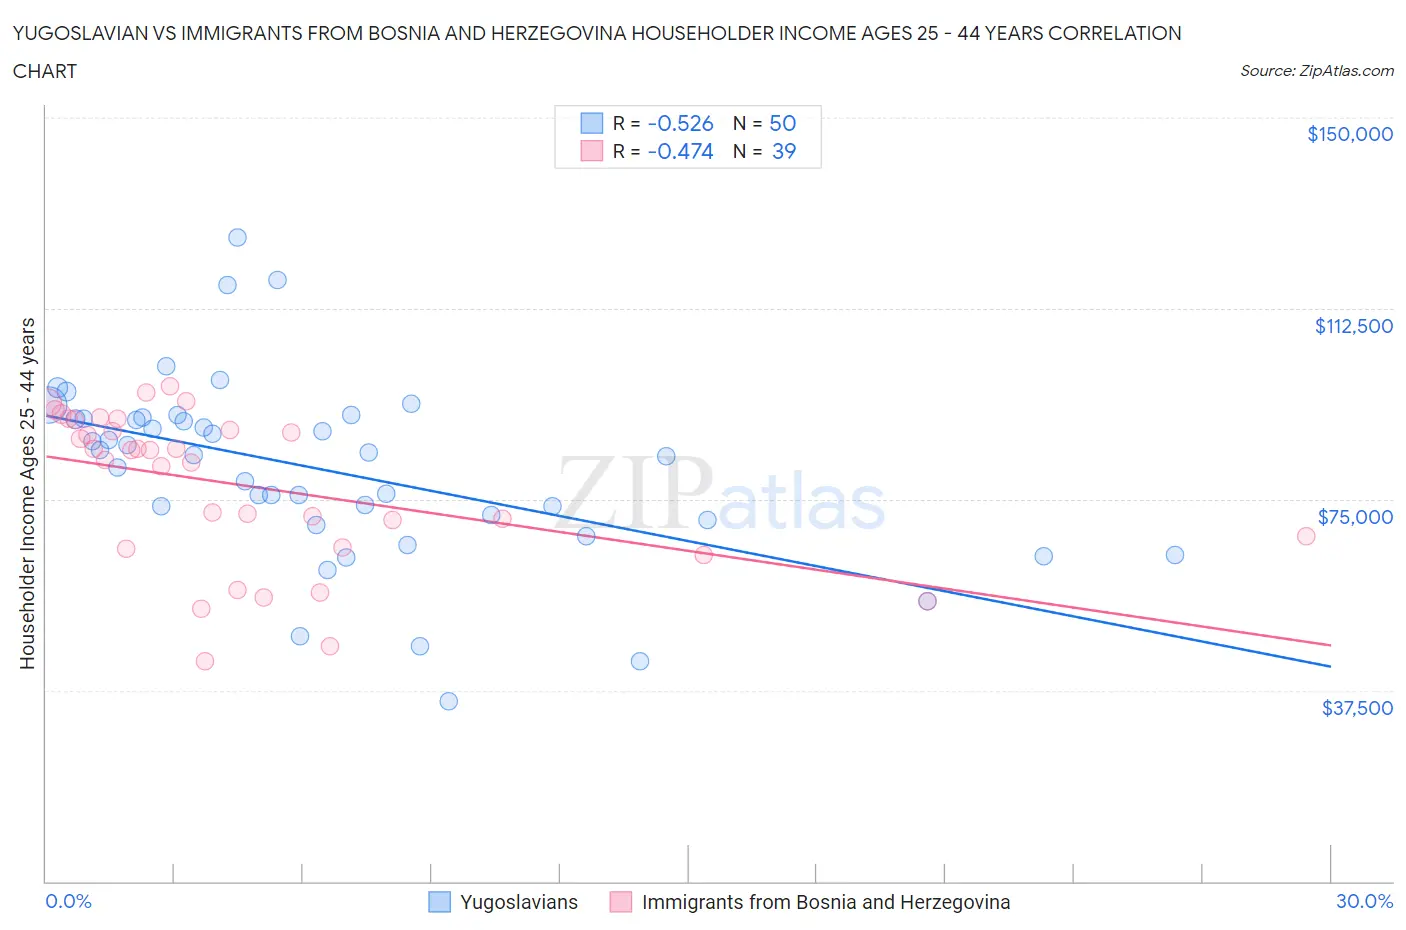
Yugoslavian vs Immigrants from Bosnia and Herzegovina Householder Income Ages 25 - 44 years Correlation Chart
The statistical analysis conducted on geographies consisting of 285,145,495 people shows a substantial negative correlation between the proportion of Yugoslavians and household income with householder between the ages 25 and 44 in the United States with a correlation coefficient (R) of -0.526 and weighted average of $91,368. Similarly, the statistical analysis conducted on geographies consisting of 156,745,458 people shows a moderate negative correlation between the proportion of Immigrants from Bosnia and Herzegovina and household income with householder between the ages 25 and 44 in the United States with a correlation coefficient (R) of -0.474 and weighted average of $88,819, a difference of 2.9%.
Householder Income Ages 25 - 44 years Correlation Summary
| Measurement | Yugoslavian | Immigrants from Bosnia and Herzegovina |
| Minimum | $35,313 | $43,125 |
| Maximum | $126,461 | $97,331 |
| Range | $91,148 | $54,206 |
| Mean | $80,797 | $77,653 |
| Median | $83,915 | $84,682 |
| Interquartile 25% (IQ1) | $71,042 | $65,598 |
| Interquartile 75% (IQ3) | $90,884 | $90,547 |
| Interquartile Range (IQR) | $19,842 | $24,949 |
| Standard Deviation (Sample) | $18,085 | $15,061 |
| Standard Deviation (Population) | $17,903 | $14,867 |
Similar Demographics by Householder Income Ages 25 - 44 years
Demographics Similar to Yugoslavians by Householder Income Ages 25 - 44 years
In terms of householder income ages 25 - 44 years, the demographic groups most similar to Yugoslavians are Aleut ($91,370, a difference of 0.0%), Immigrants from Thailand ($91,337, a difference of 0.030%), Immigrants from Eastern Africa ($91,458, a difference of 0.10%), Nepalese ($91,498, a difference of 0.14%), and Immigrants from Cambodia ($91,533, a difference of 0.18%).
| Demographics | Rating | Rank | Householder Income Ages 25 - 44 years |
| Whites/Caucasians | 16.7 /100 | #200 | Poor $91,668 |
| Japanese | 16.4 /100 | #201 | Poor $91,624 |
| Ecuadorians | 16.0 /100 | #202 | Poor $91,574 |
| Immigrants | Cambodia | 15.7 /100 | #203 | Poor $91,533 |
| Nepalese | 15.4 /100 | #204 | Poor $91,498 |
| Immigrants | Eastern Africa | 15.2 /100 | #205 | Poor $91,458 |
| Aleuts | 14.5 /100 | #206 | Poor $91,370 |
| Yugoslavians | 14.5 /100 | #207 | Poor $91,368 |
| Immigrants | Thailand | 14.3 /100 | #208 | Poor $91,337 |
| Immigrants | Uruguay | 13.2 /100 | #209 | Poor $91,171 |
| Immigrants | Kenya | 10.9 /100 | #210 | Poor $90,767 |
| Iraqis | 10.8 /100 | #211 | Poor $90,764 |
| Hawaiians | 10.6 /100 | #212 | Poor $90,722 |
| Immigrants | Bangladesh | 9.3 /100 | #213 | Tragic $90,448 |
| Immigrants | Africa | 8.9 /100 | #214 | Tragic $90,372 |
Demographics Similar to Immigrants from Bosnia and Herzegovina by Householder Income Ages 25 - 44 years
In terms of householder income ages 25 - 44 years, the demographic groups most similar to Immigrants from Bosnia and Herzegovina are Immigrants from St. Vincent and the Grenadines ($88,888, a difference of 0.080%), Immigrants from Barbados ($88,687, a difference of 0.15%), Alaskan Athabascan ($88,446, a difference of 0.42%), Immigrants from Grenada ($88,311, a difference of 0.58%), and Nonimmigrants ($88,301, a difference of 0.59%).
| Demographics | Rating | Rank | Householder Income Ages 25 - 44 years |
| Immigrants | Trinidad and Tobago | 6.5 /100 | #221 | Tragic $89,748 |
| Immigrants | Ecuador | 6.2 /100 | #222 | Tragic $89,673 |
| Immigrants | Guyana | 5.9 /100 | #223 | Tragic $89,586 |
| Barbadians | 5.9 /100 | #224 | Tragic $89,565 |
| Immigrants | Panama | 5.5 /100 | #225 | Tragic $89,451 |
| Immigrants | Iraq | 5.5 /100 | #226 | Tragic $89,444 |
| Immigrants | St. Vincent and the Grenadines | 4.1 /100 | #227 | Tragic $88,888 |
| Immigrants | Bosnia and Herzegovina | 4.0 /100 | #228 | Tragic $88,819 |
| Immigrants | Barbados | 3.7 /100 | #229 | Tragic $88,687 |
| Alaskan Athabascans | 3.3 /100 | #230 | Tragic $88,446 |
| Immigrants | Grenada | 3.0 /100 | #231 | Tragic $88,311 |
| Immigrants | Nonimmigrants | 3.0 /100 | #232 | Tragic $88,301 |
| Malaysians | 3.0 /100 | #233 | Tragic $88,291 |
| Venezuelans | 2.9 /100 | #234 | Tragic $88,232 |
| Bermudans | 2.9 /100 | #235 | Tragic $88,231 |