Yugoslavian vs Hungarian In Labor Force | Age 35-44
COMPARE
Yugoslavian
Hungarian
In Labor Force | Age 35-44
In Labor Force | Age 35-44 Comparison
Yugoslavians
Hungarians
84.9%
IN LABOR FORCE | AGE 35-44
97.7/ 100
METRIC RATING
88th/ 347
METRIC RANK
84.2%
IN LABOR FORCE | AGE 35-44
26.8/ 100
METRIC RATING
193rd/ 347
METRIC RANK
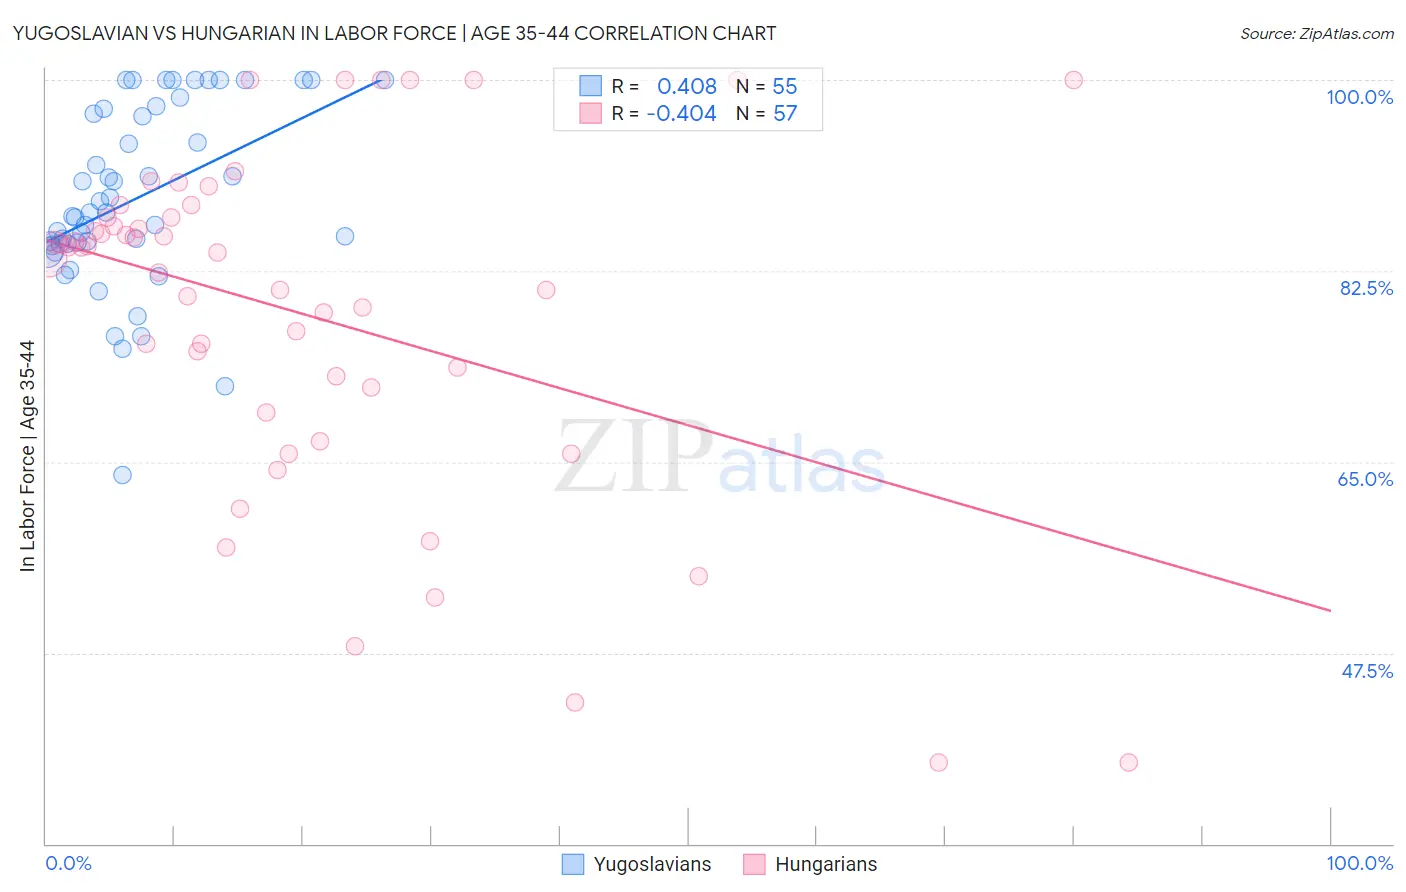
Yugoslavian vs Hungarian In Labor Force | Age 35-44 Correlation Chart
The statistical analysis conducted on geographies consisting of 285,656,710 people shows a moderate positive correlation between the proportion of Yugoslavians and labor force participation rate among population between the ages 35 and 44 in the United States with a correlation coefficient (R) of 0.408 and weighted average of 84.9%. Similarly, the statistical analysis conducted on geographies consisting of 485,922,886 people shows a moderate negative correlation between the proportion of Hungarians and labor force participation rate among population between the ages 35 and 44 in the United States with a correlation coefficient (R) of -0.404 and weighted average of 84.2%, a difference of 0.77%.
In Labor Force | Age 35-44 Correlation Summary
| Measurement | Yugoslavian | Hungarian |
| Minimum | 63.8% | 37.5% |
| Maximum | 100.0% | 100.0% |
| Range | 36.2% | 62.5% |
| Mean | 89.1% | 78.6% |
| Median | 87.9% | 84.2% |
| Interquartile 25% (IQ1) | 85.0% | 70.7% |
| Interquartile 75% (IQ3) | 97.4% | 87.4% |
| Interquartile Range (IQR) | 12.4% | 16.7% |
| Standard Deviation (Sample) | 8.3% | 15.7% |
| Standard Deviation (Population) | 8.2% | 15.6% |
Similar Demographics by In Labor Force | Age 35-44
Demographics Similar to Yugoslavians by In Labor Force | Age 35-44
In terms of in labor force | age 35-44, the demographic groups most similar to Yugoslavians are Greek (84.9%, a difference of 0.0%), Belgian (84.9%, a difference of 0.0%), Senegalese (84.9%, a difference of 0.010%), Immigrants from Peru (84.9%, a difference of 0.010%), and Immigrants from Middle Africa (84.9%, a difference of 0.010%).
| Demographics | Rating | Rank | In Labor Force | Age 35-44 |
| Immigrants | Eastern Europe | 98.3 /100 | #81 | Exceptional 84.9% |
| Immigrants | Sudan | 98.1 /100 | #82 | Exceptional 84.9% |
| Senegalese | 97.8 /100 | #83 | Exceptional 84.9% |
| Immigrants | Peru | 97.8 /100 | #84 | Exceptional 84.9% |
| Immigrants | Middle Africa | 97.8 /100 | #85 | Exceptional 84.9% |
| Greeks | 97.8 /100 | #86 | Exceptional 84.9% |
| Belgians | 97.7 /100 | #87 | Exceptional 84.9% |
| Yugoslavians | 97.7 /100 | #88 | Exceptional 84.9% |
| Immigrants | Pakistan | 97.5 /100 | #89 | Exceptional 84.9% |
| Immigrants | France | 97.4 /100 | #90 | Exceptional 84.9% |
| Immigrants | Europe | 97.2 /100 | #91 | Exceptional 84.9% |
| Ghanaians | 97.2 /100 | #92 | Exceptional 84.8% |
| Immigrants | Northern Africa | 97.1 /100 | #93 | Exceptional 84.8% |
| Mongolians | 96.8 /100 | #94 | Exceptional 84.8% |
| Immigrants | Kuwait | 96.7 /100 | #95 | Exceptional 84.8% |
Demographics Similar to Hungarians by In Labor Force | Age 35-44
In terms of in labor force | age 35-44, the demographic groups most similar to Hungarians are Immigrants from Philippines (84.2%, a difference of 0.010%), Immigrants from Vietnam (84.2%, a difference of 0.010%), Immigrants from Indonesia (84.2%, a difference of 0.010%), Immigrants from Caribbean (84.2%, a difference of 0.010%), and Immigrants from England (84.2%, a difference of 0.010%).
| Demographics | Rating | Rank | In Labor Force | Age 35-44 |
| Australians | 35.1 /100 | #186 | Fair 84.3% |
| Dutch | 34.8 /100 | #187 | Fair 84.3% |
| South Africans | 34.1 /100 | #188 | Fair 84.3% |
| Immigrants | Denmark | 33.7 /100 | #189 | Fair 84.3% |
| Portuguese | 31.9 /100 | #190 | Fair 84.3% |
| Immigrants | Philippines | 27.9 /100 | #191 | Fair 84.2% |
| Immigrants | Vietnam | 27.4 /100 | #192 | Fair 84.2% |
| Hungarians | 26.8 /100 | #193 | Fair 84.2% |
| Immigrants | Indonesia | 25.7 /100 | #194 | Fair 84.2% |
| Immigrants | Caribbean | 25.7 /100 | #195 | Fair 84.2% |
| Immigrants | England | 25.0 /100 | #196 | Fair 84.2% |
| Immigrants | Western Europe | 24.7 /100 | #197 | Fair 84.2% |
| Ecuadorians | 24.0 /100 | #198 | Fair 84.2% |
| Syrians | 23.2 /100 | #199 | Fair 84.2% |
| Moroccans | 23.2 /100 | #200 | Fair 84.2% |