Yugoslavian vs Burmese In Labor Force | Age 35-44
COMPARE
Yugoslavian
Burmese
In Labor Force | Age 35-44
In Labor Force | Age 35-44 Comparison
Yugoslavians
Burmese
84.9%
IN LABOR FORCE | AGE 35-44
97.7/ 100
METRIC RATING
88th/ 347
METRIC RANK
84.7%
IN LABOR FORCE | AGE 35-44
91.8/ 100
METRIC RATING
119th/ 347
METRIC RANK
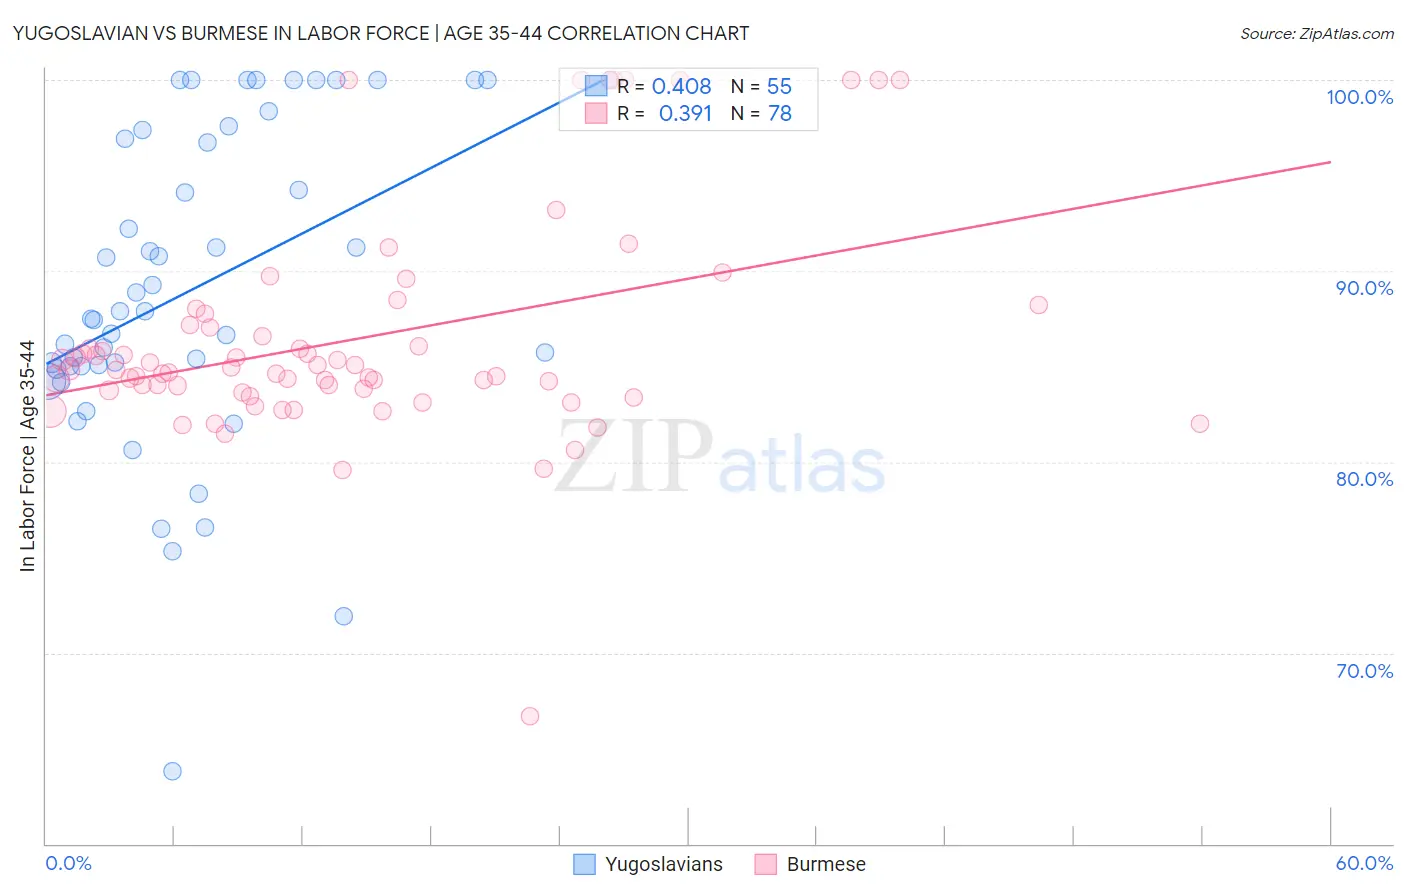
Yugoslavian vs Burmese In Labor Force | Age 35-44 Correlation Chart
The statistical analysis conducted on geographies consisting of 285,656,710 people shows a moderate positive correlation between the proportion of Yugoslavians and labor force participation rate among population between the ages 35 and 44 in the United States with a correlation coefficient (R) of 0.408 and weighted average of 84.9%. Similarly, the statistical analysis conducted on geographies consisting of 464,995,533 people shows a mild positive correlation between the proportion of Burmese and labor force participation rate among population between the ages 35 and 44 in the United States with a correlation coefficient (R) of 0.391 and weighted average of 84.7%, a difference of 0.22%.
In Labor Force | Age 35-44 Correlation Summary
| Measurement | Yugoslavian | Burmese |
| Minimum | 63.8% | 66.7% |
| Maximum | 100.0% | 100.0% |
| Range | 36.2% | 33.3% |
| Mean | 89.1% | 86.5% |
| Median | 87.9% | 84.8% |
| Interquartile 25% (IQ1) | 85.0% | 83.7% |
| Interquartile 75% (IQ3) | 97.4% | 87.2% |
| Interquartile Range (IQR) | 12.4% | 3.4% |
| Standard Deviation (Sample) | 8.3% | 5.9% |
| Standard Deviation (Population) | 8.2% | 5.8% |
Similar Demographics by In Labor Force | Age 35-44
Demographics Similar to Yugoslavians by In Labor Force | Age 35-44
In terms of in labor force | age 35-44, the demographic groups most similar to Yugoslavians are Greek (84.9%, a difference of 0.0%), Belgian (84.9%, a difference of 0.0%), Senegalese (84.9%, a difference of 0.010%), Immigrants from Peru (84.9%, a difference of 0.010%), and Immigrants from Middle Africa (84.9%, a difference of 0.010%).
| Demographics | Rating | Rank | In Labor Force | Age 35-44 |
| Immigrants | Eastern Europe | 98.3 /100 | #81 | Exceptional 84.9% |
| Immigrants | Sudan | 98.1 /100 | #82 | Exceptional 84.9% |
| Senegalese | 97.8 /100 | #83 | Exceptional 84.9% |
| Immigrants | Peru | 97.8 /100 | #84 | Exceptional 84.9% |
| Immigrants | Middle Africa | 97.8 /100 | #85 | Exceptional 84.9% |
| Greeks | 97.8 /100 | #86 | Exceptional 84.9% |
| Belgians | 97.7 /100 | #87 | Exceptional 84.9% |
| Yugoslavians | 97.7 /100 | #88 | Exceptional 84.9% |
| Immigrants | Pakistan | 97.5 /100 | #89 | Exceptional 84.9% |
| Immigrants | France | 97.4 /100 | #90 | Exceptional 84.9% |
| Immigrants | Europe | 97.2 /100 | #91 | Exceptional 84.9% |
| Ghanaians | 97.2 /100 | #92 | Exceptional 84.8% |
| Immigrants | Northern Africa | 97.1 /100 | #93 | Exceptional 84.8% |
| Mongolians | 96.8 /100 | #94 | Exceptional 84.8% |
| Immigrants | Kuwait | 96.7 /100 | #95 | Exceptional 84.8% |
Demographics Similar to Burmese by In Labor Force | Age 35-44
In terms of in labor force | age 35-44, the demographic groups most similar to Burmese are Immigrants from Northern Europe (84.7%, a difference of 0.0%), Immigrants from China (84.7%, a difference of 0.010%), Immigrants from Eastern Asia (84.7%, a difference of 0.010%), Finnish (84.7%, a difference of 0.010%), and German (84.7%, a difference of 0.010%).
| Demographics | Rating | Rank | In Labor Force | Age 35-44 |
| Immigrants | Western Africa | 93.4 /100 | #112 | Exceptional 84.7% |
| Uruguayans | 93.3 /100 | #113 | Exceptional 84.7% |
| Chileans | 93.2 /100 | #114 | Exceptional 84.7% |
| Bahamians | 93.2 /100 | #115 | Exceptional 84.7% |
| Immigrants | Egypt | 92.7 /100 | #116 | Exceptional 84.7% |
| Immigrants | China | 92.3 /100 | #117 | Exceptional 84.7% |
| Immigrants | Eastern Asia | 92.1 /100 | #118 | Exceptional 84.7% |
| Burmese | 91.8 /100 | #119 | Exceptional 84.7% |
| Immigrants | Northern Europe | 91.5 /100 | #120 | Exceptional 84.7% |
| Finns | 91.2 /100 | #121 | Exceptional 84.7% |
| Germans | 91.0 /100 | #122 | Exceptional 84.7% |
| Immigrants | South America | 90.9 /100 | #123 | Exceptional 84.7% |
| Slavs | 90.8 /100 | #124 | Exceptional 84.7% |
| Maltese | 90.8 /100 | #125 | Exceptional 84.7% |
| Asians | 90.6 /100 | #126 | Exceptional 84.7% |