Yugoslavian vs Immigrants from Laos In Labor Force | Age 35-44
COMPARE
Yugoslavian
Immigrants from Laos
In Labor Force | Age 35-44
In Labor Force | Age 35-44 Comparison
Yugoslavians
Immigrants from Laos
84.9%
IN LABOR FORCE | AGE 35-44
97.7/ 100
METRIC RATING
88th/ 347
METRIC RANK
83.8%
IN LABOR FORCE | AGE 35-44
1.7/ 100
METRIC RATING
238th/ 347
METRIC RANK
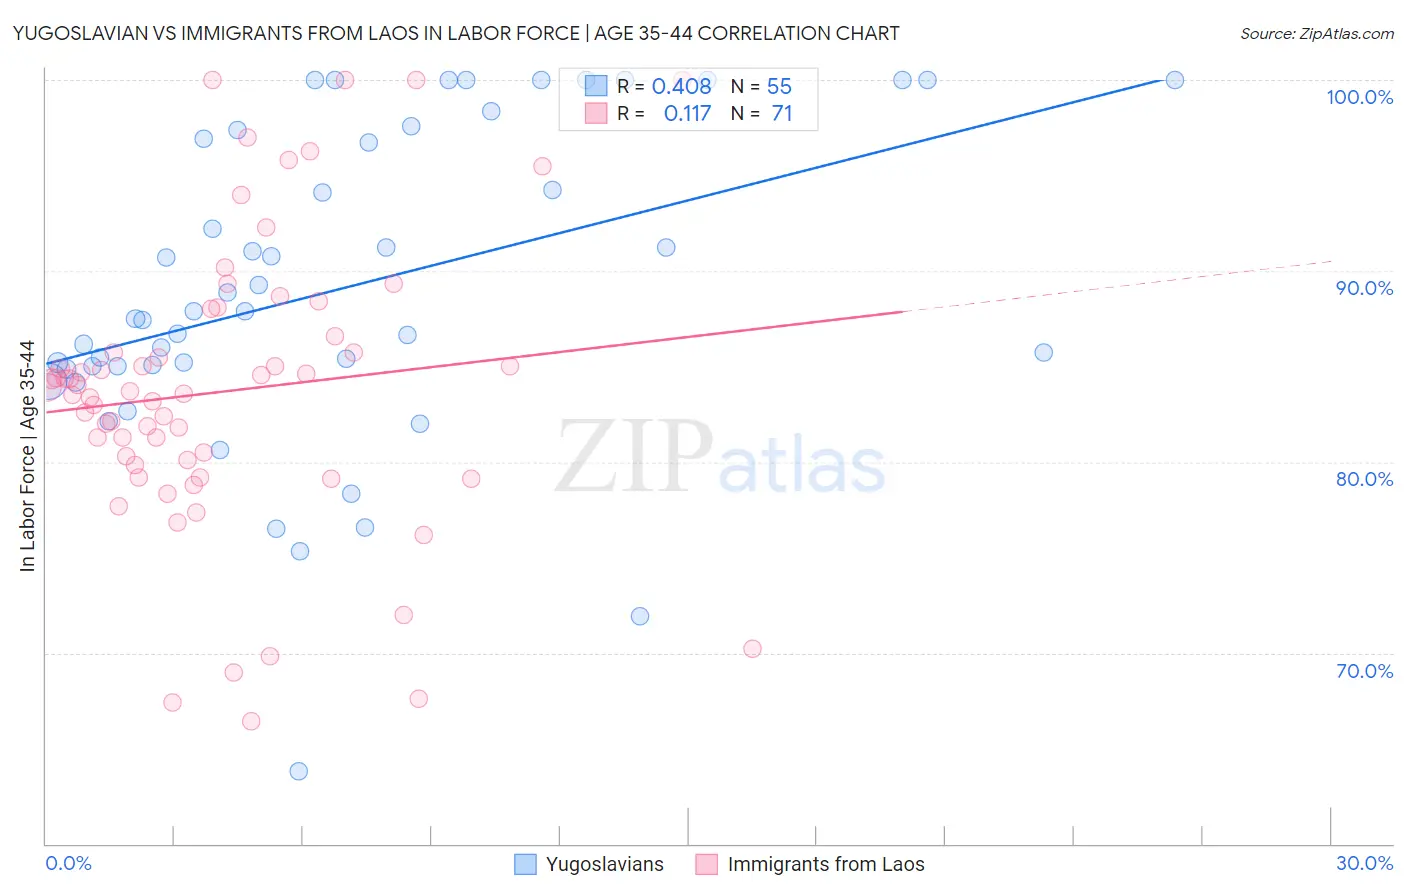
Yugoslavian vs Immigrants from Laos In Labor Force | Age 35-44 Correlation Chart
The statistical analysis conducted on geographies consisting of 285,656,710 people shows a moderate positive correlation between the proportion of Yugoslavians and labor force participation rate among population between the ages 35 and 44 in the United States with a correlation coefficient (R) of 0.408 and weighted average of 84.9%. Similarly, the statistical analysis conducted on geographies consisting of 201,470,158 people shows a poor positive correlation between the proportion of Immigrants from Laos and labor force participation rate among population between the ages 35 and 44 in the United States with a correlation coefficient (R) of 0.117 and weighted average of 83.8%, a difference of 1.3%.
In Labor Force | Age 35-44 Correlation Summary
| Measurement | Yugoslavian | Immigrants from Laos |
| Minimum | 63.8% | 66.4% |
| Maximum | 100.0% | 100.0% |
| Range | 36.2% | 33.6% |
| Mean | 89.1% | 83.7% |
| Median | 87.9% | 83.7% |
| Interquartile 25% (IQ1) | 85.0% | 79.8% |
| Interquartile 75% (IQ3) | 97.4% | 86.6% |
| Interquartile Range (IQR) | 12.4% | 6.8% |
| Standard Deviation (Sample) | 8.3% | 7.6% |
| Standard Deviation (Population) | 8.2% | 7.5% |
Similar Demographics by In Labor Force | Age 35-44
Demographics Similar to Yugoslavians by In Labor Force | Age 35-44
In terms of in labor force | age 35-44, the demographic groups most similar to Yugoslavians are Greek (84.9%, a difference of 0.0%), Belgian (84.9%, a difference of 0.0%), Senegalese (84.9%, a difference of 0.010%), Immigrants from Peru (84.9%, a difference of 0.010%), and Immigrants from Middle Africa (84.9%, a difference of 0.010%).
| Demographics | Rating | Rank | In Labor Force | Age 35-44 |
| Immigrants | Eastern Europe | 98.3 /100 | #81 | Exceptional 84.9% |
| Immigrants | Sudan | 98.1 /100 | #82 | Exceptional 84.9% |
| Senegalese | 97.8 /100 | #83 | Exceptional 84.9% |
| Immigrants | Peru | 97.8 /100 | #84 | Exceptional 84.9% |
| Immigrants | Middle Africa | 97.8 /100 | #85 | Exceptional 84.9% |
| Greeks | 97.8 /100 | #86 | Exceptional 84.9% |
| Belgians | 97.7 /100 | #87 | Exceptional 84.9% |
| Yugoslavians | 97.7 /100 | #88 | Exceptional 84.9% |
| Immigrants | Pakistan | 97.5 /100 | #89 | Exceptional 84.9% |
| Immigrants | France | 97.4 /100 | #90 | Exceptional 84.9% |
| Immigrants | Europe | 97.2 /100 | #91 | Exceptional 84.9% |
| Ghanaians | 97.2 /100 | #92 | Exceptional 84.8% |
| Immigrants | Northern Africa | 97.1 /100 | #93 | Exceptional 84.8% |
| Mongolians | 96.8 /100 | #94 | Exceptional 84.8% |
| Immigrants | Kuwait | 96.7 /100 | #95 | Exceptional 84.8% |
Demographics Similar to Immigrants from Laos by In Labor Force | Age 35-44
In terms of in labor force | age 35-44, the demographic groups most similar to Immigrants from Laos are English (83.8%, a difference of 0.020%), Celtic (83.8%, a difference of 0.030%), Arab (83.8%, a difference of 0.040%), Iraqi (83.8%, a difference of 0.040%), and Immigrants from Syria (83.9%, a difference of 0.060%).
| Demographics | Rating | Rank | In Labor Force | Age 35-44 |
| Scottish | 3.2 /100 | #231 | Tragic 83.9% |
| Native Hawaiians | 3.0 /100 | #232 | Tragic 83.9% |
| Immigrants | Germany | 2.8 /100 | #233 | Tragic 83.9% |
| Immigrants | Oceania | 2.6 /100 | #234 | Tragic 83.9% |
| Immigrants | Syria | 2.5 /100 | #235 | Tragic 83.9% |
| West Indians | 2.4 /100 | #236 | Tragic 83.9% |
| English | 1.8 /100 | #237 | Tragic 83.8% |
| Immigrants | Laos | 1.7 /100 | #238 | Tragic 83.8% |
| Celtics | 1.4 /100 | #239 | Tragic 83.8% |
| Arabs | 1.3 /100 | #240 | Tragic 83.8% |
| Iraqis | 1.3 /100 | #241 | Tragic 83.8% |
| Immigrants | Cambodia | 1.1 /100 | #242 | Tragic 83.8% |
| Immigrants | Western Asia | 1.1 /100 | #243 | Tragic 83.8% |
| Guyanese | 1.1 /100 | #244 | Tragic 83.8% |
| Malaysians | 1.1 /100 | #245 | Tragic 83.8% |