Immigrants from Russia vs Hungarian In Labor Force | Age 35-44
COMPARE
Immigrants from Russia
Hungarian
In Labor Force | Age 35-44
In Labor Force | Age 35-44 Comparison
Immigrants from Russia
Hungarians
84.8%
IN LABOR FORCE | AGE 35-44
94.5/ 100
METRIC RATING
109th/ 347
METRIC RANK
84.2%
IN LABOR FORCE | AGE 35-44
26.8/ 100
METRIC RATING
193rd/ 347
METRIC RANK
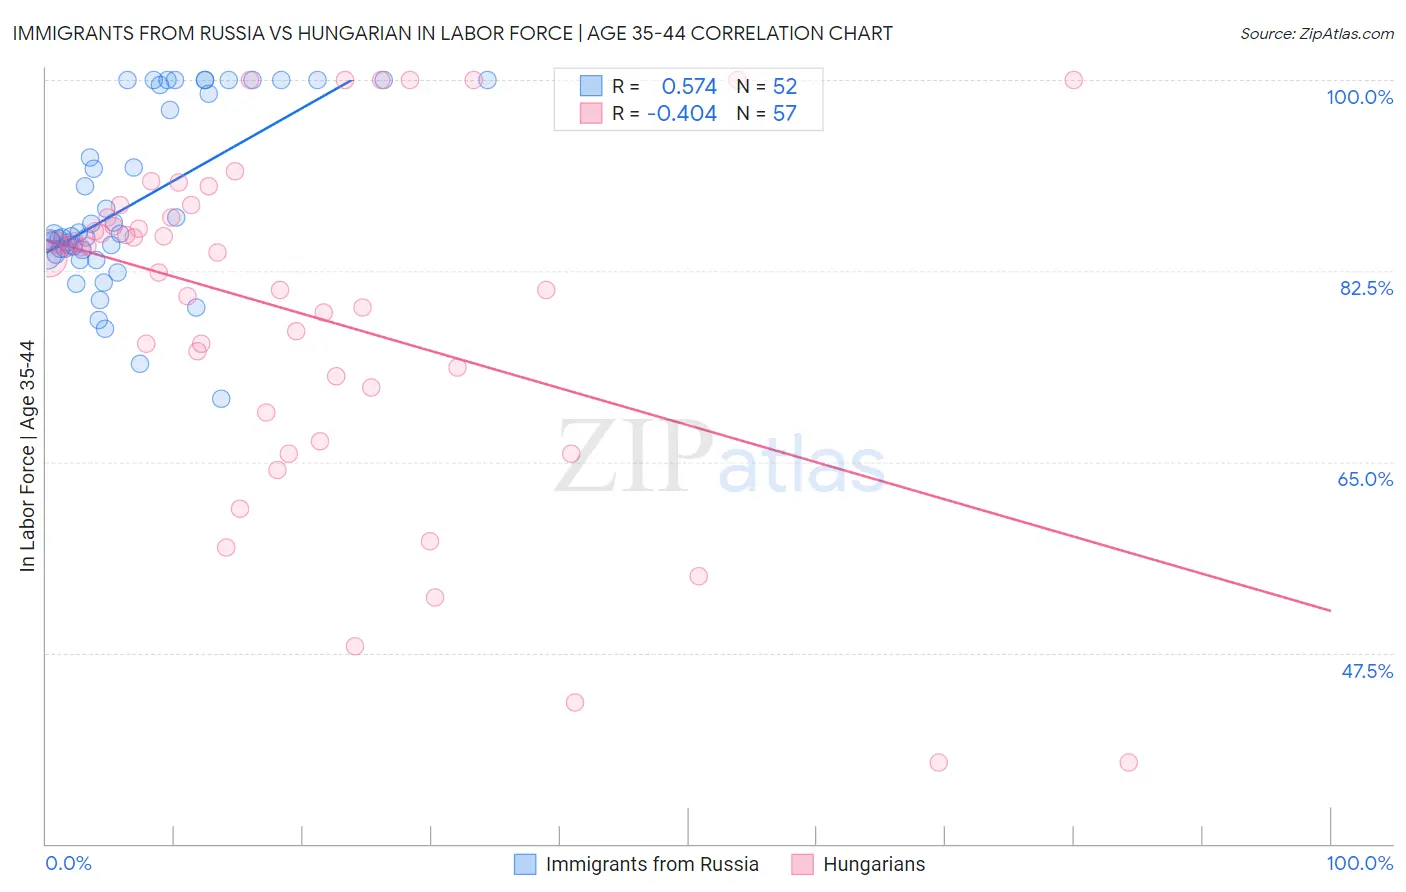
Immigrants from Russia vs Hungarian In Labor Force | Age 35-44 Correlation Chart
The statistical analysis conducted on geographies consisting of 347,745,302 people shows a substantial positive correlation between the proportion of Immigrants from Russia and labor force participation rate among population between the ages 35 and 44 in the United States with a correlation coefficient (R) of 0.574 and weighted average of 84.8%. Similarly, the statistical analysis conducted on geographies consisting of 485,922,886 people shows a moderate negative correlation between the proportion of Hungarians and labor force participation rate among population between the ages 35 and 44 in the United States with a correlation coefficient (R) of -0.404 and weighted average of 84.2%, a difference of 0.62%.
In Labor Force | Age 35-44 Correlation Summary
| Measurement | Immigrants from Russia | Hungarian |
| Minimum | 70.8% | 37.5% |
| Maximum | 100.0% | 100.0% |
| Range | 29.2% | 62.5% |
| Mean | 88.7% | 78.6% |
| Median | 85.8% | 84.2% |
| Interquartile 25% (IQ1) | 84.2% | 70.7% |
| Interquartile 75% (IQ3) | 99.1% | 87.4% |
| Interquartile Range (IQR) | 14.9% | 16.7% |
| Standard Deviation (Sample) | 8.0% | 15.7% |
| Standard Deviation (Population) | 7.9% | 15.6% |
Similar Demographics by In Labor Force | Age 35-44
Demographics Similar to Immigrants from Russia by In Labor Force | Age 35-44
In terms of in labor force | age 35-44, the demographic groups most similar to Immigrants from Russia are Immigrants from Argentina (84.8%, a difference of 0.0%), Immigrants from Bahamas (84.8%, a difference of 0.010%), Immigrants from Romania (84.8%, a difference of 0.010%), Immigrants from Sweden (84.8%, a difference of 0.020%), and South American (84.8%, a difference of 0.020%).
| Demographics | Rating | Rank | In Labor Force | Age 35-44 |
| Immigrants | Southern Europe | 95.3 /100 | #102 | Exceptional 84.8% |
| Immigrants | Belarus | 95.3 /100 | #103 | Exceptional 84.8% |
| Immigrants | Sweden | 95.2 /100 | #104 | Exceptional 84.8% |
| South Americans | 95.0 /100 | #105 | Exceptional 84.8% |
| Immigrants | Bahamas | 94.8 /100 | #106 | Exceptional 84.8% |
| Immigrants | Romania | 94.7 /100 | #107 | Exceptional 84.8% |
| Immigrants | Argentina | 94.5 /100 | #108 | Exceptional 84.8% |
| Immigrants | Russia | 94.5 /100 | #109 | Exceptional 84.8% |
| Filipinos | 93.8 /100 | #110 | Exceptional 84.7% |
| Ukrainians | 93.5 /100 | #111 | Exceptional 84.7% |
| Immigrants | Western Africa | 93.4 /100 | #112 | Exceptional 84.7% |
| Uruguayans | 93.3 /100 | #113 | Exceptional 84.7% |
| Chileans | 93.2 /100 | #114 | Exceptional 84.7% |
| Bahamians | 93.2 /100 | #115 | Exceptional 84.7% |
| Immigrants | Egypt | 92.7 /100 | #116 | Exceptional 84.7% |
Demographics Similar to Hungarians by In Labor Force | Age 35-44
In terms of in labor force | age 35-44, the demographic groups most similar to Hungarians are Immigrants from Philippines (84.2%, a difference of 0.010%), Immigrants from Vietnam (84.2%, a difference of 0.010%), Immigrants from Indonesia (84.2%, a difference of 0.010%), Immigrants from Caribbean (84.2%, a difference of 0.010%), and Immigrants from England (84.2%, a difference of 0.010%).
| Demographics | Rating | Rank | In Labor Force | Age 35-44 |
| Australians | 35.1 /100 | #186 | Fair 84.3% |
| Dutch | 34.8 /100 | #187 | Fair 84.3% |
| South Africans | 34.1 /100 | #188 | Fair 84.3% |
| Immigrants | Denmark | 33.7 /100 | #189 | Fair 84.3% |
| Portuguese | 31.9 /100 | #190 | Fair 84.3% |
| Immigrants | Philippines | 27.9 /100 | #191 | Fair 84.2% |
| Immigrants | Vietnam | 27.4 /100 | #192 | Fair 84.2% |
| Hungarians | 26.8 /100 | #193 | Fair 84.2% |
| Immigrants | Indonesia | 25.7 /100 | #194 | Fair 84.2% |
| Immigrants | Caribbean | 25.7 /100 | #195 | Fair 84.2% |
| Immigrants | England | 25.0 /100 | #196 | Fair 84.2% |
| Immigrants | Western Europe | 24.7 /100 | #197 | Fair 84.2% |
| Ecuadorians | 24.0 /100 | #198 | Fair 84.2% |
| Syrians | 23.2 /100 | #199 | Fair 84.2% |
| Moroccans | 23.2 /100 | #200 | Fair 84.2% |