Yugoslavian vs Hungarian 8th Grade

COMPARE

Yugoslavian
Race
Ancestry
AfghanAfricanAlaska NativeAlaskan AthabascanAlbanianAleutAlsatianAmericanApacheArabArapahoArgentineanArmenianAssyrian/Chaldean/SyriacAustralianAustrianBahamianBangladeshiBarbadianBasqueBelgianBelizeanBermudanBhutaneseBlackfeetBolivianBrazilianBritishBritish West IndianBulgarianBurmeseCajunCambodianCanadianCape VerdeanCarpatho RusynCelticCentral AmericanCentral American IndianCherokeeCheyenneChickasawChileanChineseChippewaChoctawColombianColvilleComancheCosta RicanCreeCreekCroatianCrowCubanCypriotCzechCzechoslovakianDanishDelawareDominicanDutchDutch West IndianEastern EuropeanEcuadorianEgyptianEnglishEstonianEthiopianEuropeanFijianFilipinoFinnishFrenchFrench American IndianFrench CanadianGermanGerman RussianGhanaianGreekGuamanian/ChamorroGuatemalanGuyaneseHaitianHmongHonduranHopiHoumaIcelanderIndian (Asian)IndonesianInupiatIranianIraqiIrishIroquoisIsraeliItalianJamaicanJapaneseJordanianKenyanKiowaKoreanLaotianLatvianLebaneseLiberianLithuanianLumbeeLuxembourgerMacedonianMalaysianMalteseMarshalleseMenomineeMexicanMexican American IndianMongolianMoroccanNative HawaiianNavajoNepaleseNew ZealanderNicaraguanNigerianNorthern EuropeanNorwegianOkinawanOsageOttawaPaiutePakistaniPalestinianPanamanianParaguayanPennsylvania GermanPeruvianPimaPolishPortuguesePotawatomiPuebloPuerto RicanPuget Sound SalishRomanianRussianSalvadoranSamoanScandinavianScotch-IrishScottishSeminoleSenegaleseSerbianShoshoneSierra LeoneanSiouxSlavicSlovakSloveneSomaliSouth AfricanSouth AmericanSouth American IndianSoviet UnionSpaniardSpanishSpanish AmericanSpanish American IndianSri LankanSubsaharan AfricanSudaneseSwedishSwissSyrianTaiwaneseThaiTlingit-HaidaTohono O'OdhamTonganTrinidadian and TobagonianTsimshianTurkishU.S. Virgin IslanderUgandanUkrainianUruguayanUteVenezuelanVietnameseWelshWest IndianYakamaYaquiYugoslavianYumanYup'ikZimbabwean
Immigration
NonimmigrantsImmigrantsAfghanistanAfricaAlbaniaArgentinaArmeniaAsiaAustraliaAustriaBahamasBangladeshBarbadosBelarusBelgiumBelizeBoliviaBosnia and HerzegovinaBrazilBulgariaBurma/MyanmarCabo VerdeCambodiaCameroonCanadaCaribbeanCentral AmericaChileChinaColombiaCongoCosta RicaCroatiaCubaCzechoslovakiaDenmarkDominicaDominican RepublicEastern AfricaEastern AsiaEastern EuropeEcuadorEgyptEl SalvadorEnglandEritreaEthiopiaEuropeFijiFranceGermanyGhanaGreeceGrenadaGuatemalaGuyanaHaitiHondurasHong KongHungaryIndiaIndonesiaIranIraqIrelandIsraelItalyJamaicaJapanJordanKazakhstanKenyaKoreaKuwaitLaosLatin AmericaLatviaLebanonLiberiaLithuaniaMalaysiaMexicoMicronesiaMiddle AfricaMoldovaMoroccoNepalNetherlandsNicaraguaNigeriaNorth AmericaNorth MacedoniaNorthern AfricaNorthern EuropeNorwayOceaniaPakistanPanamaPeruPhilippinesPolandPortugalRomaniaRussiaSaudi ArabiaScotlandSenegalSerbiaSierra LeoneSingaporeSomaliaSouth AfricaSouth AmericaSouth Central AsiaSouth Eastern AsiaSouthern EuropeSpainSri LankaSt. Vincent and the GrenadinesSudanSwedenSwitzerlandSyriaTaiwanThailandTrinidad and TobagoTurkeyUgandaUkraineUruguayUzbekistanVenezuelaVietnamWest IndiesWestern AfricaWestern AsiaWestern EuropeYemenZaireZimbabweAzores
Hungarian
Race
Ancestry
AfghanAfricanAlaska NativeAlaskan AthabascanAlbanianAleutAlsatianAmericanApacheArabArapahoArgentineanArmenianAssyrian/Chaldean/SyriacAustralianAustrianBahamianBangladeshiBarbadianBasqueBelgianBelizeanBermudanBhutaneseBlackfeetBolivianBrazilianBritishBritish West IndianBulgarianBurmeseCajunCambodianCanadianCape VerdeanCarpatho RusynCelticCentral AmericanCentral American IndianCherokeeCheyenneChickasawChileanChineseChippewaChoctawColombianColvilleComancheCosta RicanCreeCreekCroatianCrowCubanCypriotCzechCzechoslovakianDanishDelawareDominicanDutchDutch West IndianEastern EuropeanEcuadorianEgyptianEnglishEstonianEthiopianEuropeanFijianFilipinoFinnishFrenchFrench American IndianFrench CanadianGermanGerman RussianGhanaianGreekGuamanian/ChamorroGuatemalanGuyaneseHaitianHmongHonduranHopiHoumaHungarianIcelanderIndian (Asian)IndonesianInupiatIranianIraqiIrishIroquoisIsraeliItalianJamaicanJapaneseJordanianKenyanKiowaKoreanLaotianLatvianLebaneseLiberianLithuanianLumbeeLuxembourgerMacedonianMalaysianMalteseMarshalleseMenomineeMexicanMexican American IndianMongolianMoroccanNative HawaiianNavajoNepaleseNew ZealanderNicaraguanNigerianNorthern EuropeanNorwegianOkinawanOsageOttawaPaiutePakistaniPalestinianPanamanianParaguayanPennsylvania GermanPeruvianPimaPolishPortuguesePotawatomiPuebloPuerto RicanPuget Sound SalishRomanianRussianSalvadoranSamoanScandinavianScotch-IrishScottishSeminoleSenegaleseSerbianShoshoneSierra LeoneanSiouxSlavicSlovakSloveneSomaliSouth AfricanSouth AmericanSouth American IndianSoviet UnionSpaniardSpanishSpanish AmericanSpanish American IndianSri LankanSubsaharan AfricanSudaneseSwedishSwissSyrianTaiwaneseThaiTlingit-HaidaTohono O'OdhamTonganTrinidadian and TobagonianTsimshianTurkishU.S. Virgin IslanderUgandanUkrainianUruguayanUteVenezuelanVietnameseWelshWest IndianYakamaYaquiYumanYup'ikZimbabwean
Immigration
NonimmigrantsImmigrantsAfghanistanAfricaAlbaniaArgentinaArmeniaAsiaAustraliaAustriaBahamasBangladeshBarbadosBelarusBelgiumBelizeBoliviaBosnia and HerzegovinaBrazilBulgariaBurma/MyanmarCabo VerdeCambodiaCameroonCanadaCaribbeanCentral AmericaChileChinaColombiaCongoCosta RicaCroatiaCubaCzechoslovakiaDenmarkDominicaDominican RepublicEastern AfricaEastern AsiaEastern EuropeEcuadorEgyptEl SalvadorEnglandEritreaEthiopiaEuropeFijiFranceGermanyGhanaGreeceGrenadaGuatemalaGuyanaHaitiHondurasHong KongHungaryIndiaIndonesiaIranIraqIrelandIsraelItalyJamaicaJapanJordanKazakhstanKenyaKoreaKuwaitLaosLatin AmericaLatviaLebanonLiberiaLithuaniaMalaysiaMexicoMicronesiaMiddle AfricaMoldovaMoroccoNepalNetherlandsNicaraguaNigeriaNorth AmericaNorth MacedoniaNorthern AfricaNorthern EuropeNorwayOceaniaPakistanPanamaPeruPhilippinesPolandPortugalRomaniaRussiaSaudi ArabiaScotlandSenegalSerbiaSierra LeoneSingaporeSomaliaSouth AfricaSouth AmericaSouth Central AsiaSouth Eastern AsiaSouthern EuropeSpainSri LankaSt. Vincent and the GrenadinesSudanSwedenSwitzerlandSyriaTaiwanThailandTrinidad and TobagoTurkeyUgandaUkraineUruguayUzbekistanVenezuelaVietnamWest IndiesWestern AfricaWestern AsiaWestern EuropeYemenZaireZimbabweAzores
8th Grade
Income
Poverty
Unemployment
Labor Participation
Family Structure
Vehicle Availability
Education Level
Disability

8th Grade Comparison

Yugoslavians

Hungarians

Exceptional
Exceptional
96.5%
8TH GRADE
99.4/ 100
METRIC RATING
78th/ 347
METRIC RANK
97.0%
8TH GRADE
100.0/ 100
METRIC RATING
39th/ 347
METRIC RANK

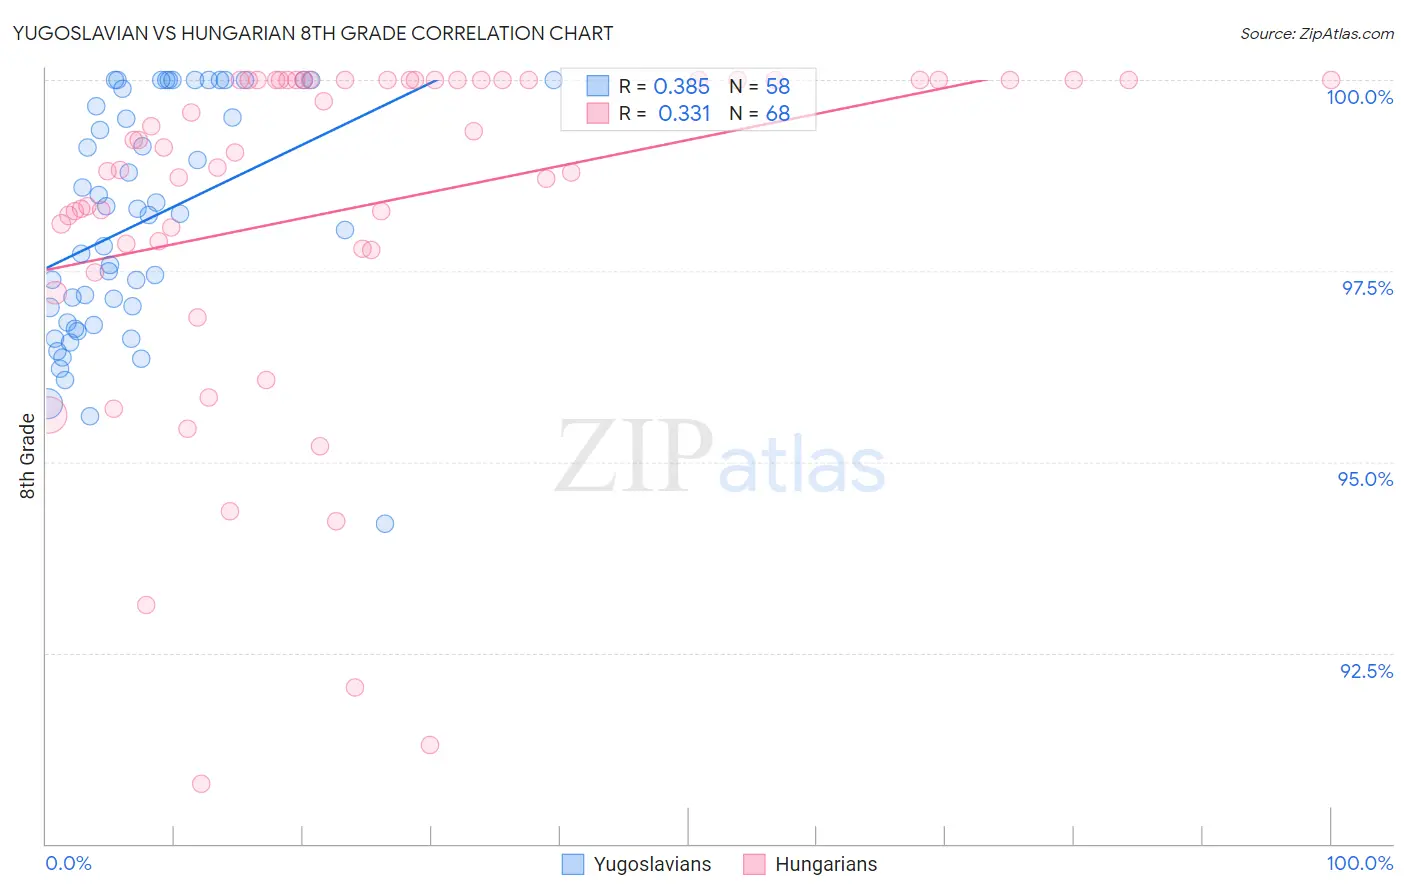
Yugoslavian vs Hungarian 8th Grade Correlation Chart

The statistical analysis conducted on geographies consisting of 285,618,157 people shows a mild positive correlation between the proportion of Yugoslavians and percentage of population with at least 8th grade education in the United States with a correlation coefficient (R) of 0.385 and weighted average of 96.5%. Similarly, the statistical analysis conducted on geographies consisting of 486,239,439 people shows a mild positive correlation between the proportion of Hungarians and percentage of population with at least 8th grade education in the United States with a correlation coefficient (R) of 0.331 and weighted average of 97.0%, a difference of 0.46%.
Yugoslavian vs Hungarian 8th Grade

8th Grade Correlation Summary

MeasurementYugoslavianHungarian
Minimum94.2%90.8%
Maximum100.0%100.0%
Range5.8%9.2%
Mean98.2%98.3%
Median98.2%99.1%
Interquartile 25% (IQ1)96.8%97.8%
Interquartile 75% (IQ3)99.9%100.0%
Interquartile Range (IQR)3.1%2.2%
Standard Deviation (Sample)1.5%2.3%
Standard Deviation (Population)1.5%2.2%

Similar Demographics by 8th Grade

Demographics Similar to Yugoslavians by 8th Grade

In terms of 8th grade, the demographic groups most similar to Yugoslavians are Cypriot (96.5%, a difference of 0.0%), Zimbabwean (96.5%, a difference of 0.010%), Immigrants from Netherlands (96.5%, a difference of 0.010%), Immigrants from Ireland (96.5%, a difference of 0.020%), and Puget Sound Salish (96.5%, a difference of 0.020%).
DemographicsRating | Rank8th Grade
New Zealanders
99.5
/100
|
#71
Exceptional
96.6%
Immigrants | England
99.5
/100
|
#72
Exceptional
96.6%
Arapaho
99.5
/100
|
#73
Exceptional
96.6%
Immigrants | Ireland
99.5
/100
|
#74
Exceptional
96.5%
Zimbabweans
99.4
/100
|
#75
Exceptional
96.5%
Immigrants | Netherlands
99.4
/100
|
#76
Exceptional
96.5%
Cypriots
99.4
/100
|
#77
Exceptional
96.5%
Yugoslavians
99.4
/100
|
#78
Exceptional
96.5%
Puget Sound Salish
99.3
/100
|
#79
Exceptional
96.5%
Delaware
99.2
/100
|
#80
Exceptional
96.5%
Romanians
99.2
/100
|
#81
Exceptional
96.5%
Turks
99.2
/100
|
#82
Exceptional
96.5%
Icelanders
99.2
/100
|
#83
Exceptional
96.5%
Immigrants | Belgium
99.1
/100
|
#84
Exceptional
96.5%
Immigrants | South Africa
99.1
/100
|
#85
Exceptional
96.5%

Demographics Similar to Hungarians by 8th Grade

In terms of 8th grade, the demographic groups most similar to Hungarians are British (97.0%, a difference of 0.0%), Inupiat (97.0%, a difference of 0.010%), Belgian (97.0%, a difference of 0.020%), Latvian (97.0%, a difference of 0.020%), and Eastern European (97.0%, a difference of 0.020%).
DemographicsRating | Rank8th Grade
Yup'ik
100.0
/100
|
#32
Exceptional
97.0%
Swiss
100.0
/100
|
#33
Exceptional
97.0%
Luxembourgers
100.0
/100
|
#34
Exceptional
97.0%
Alaska Natives
100.0
/100
|
#35
Exceptional
97.0%
Belgians
100.0
/100
|
#36
Exceptional
97.0%
Latvians
100.0
/100
|
#37
Exceptional
97.0%
British
100.0
/100
|
#38
Exceptional
97.0%
Hungarians
100.0
/100
|
#39
Exceptional
97.0%
Inupiat
100.0
/100
|
#40
Exceptional
97.0%
Eastern Europeans
100.0
/100
|
#41
Exceptional
97.0%
Chinese
100.0
/100
|
#42
Exceptional
96.9%
Aleuts
99.9
/100
|
#43
Exceptional
96.9%
Maltese
99.9
/100
|
#44
Exceptional
96.9%
Northern Europeans
99.9
/100
|
#45
Exceptional
96.9%
Czechoslovakians
99.9
/100
|
#46
Exceptional
96.9%