Yugoslavian vs African In Labor Force | Age 35-44
COMPARE
Yugoslavian
African
In Labor Force | Age 35-44
In Labor Force | Age 35-44 Comparison
Yugoslavians
Africans
84.9%
IN LABOR FORCE | AGE 35-44
97.7/ 100
METRIC RATING
88th/ 347
METRIC RANK
82.9%
IN LABOR FORCE | AGE 35-44
0.0/ 100
METRIC RATING
290th/ 347
METRIC RANK
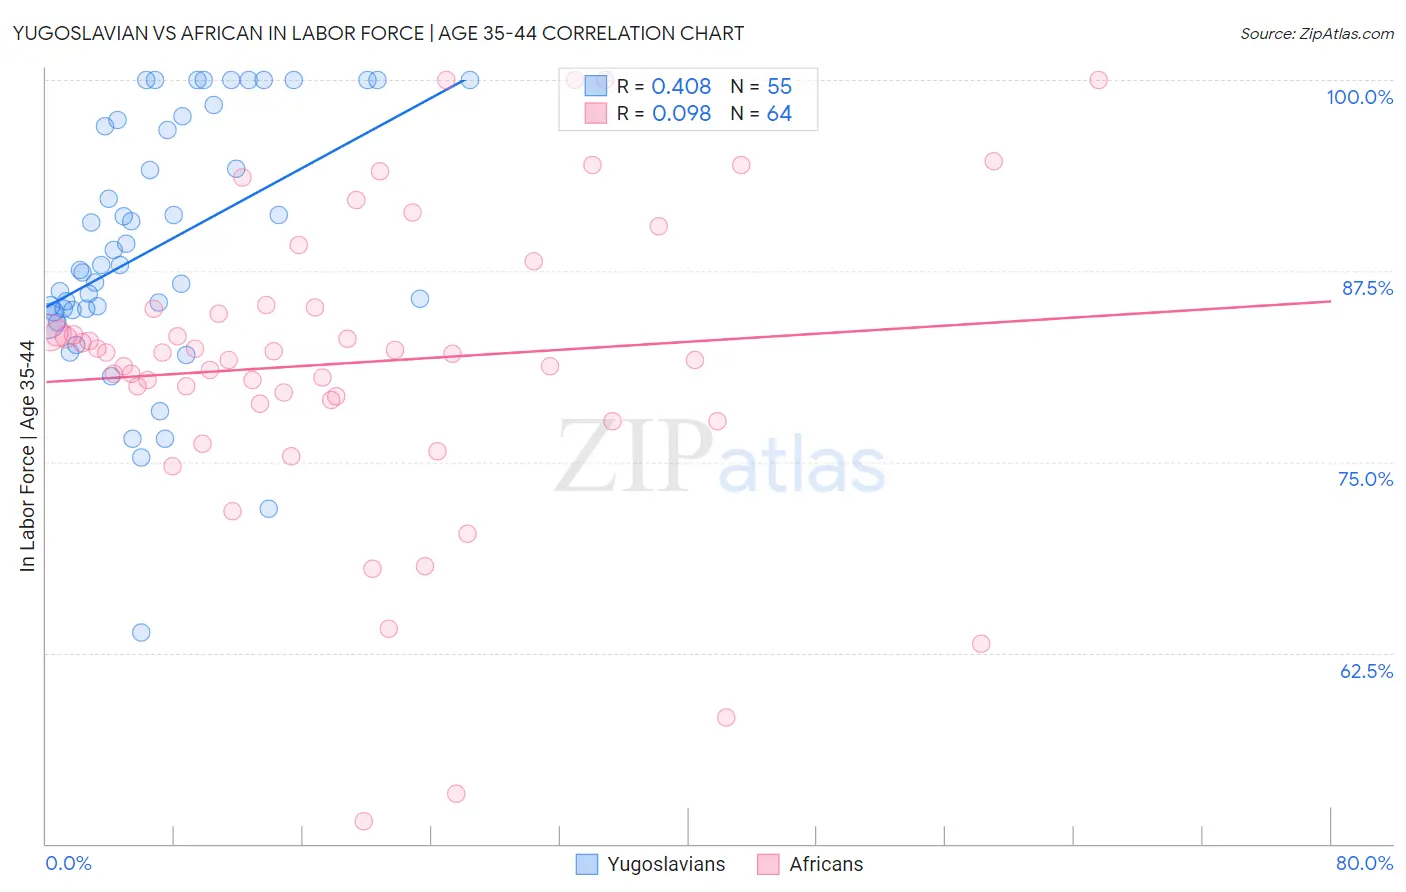
Yugoslavian vs African In Labor Force | Age 35-44 Correlation Chart
The statistical analysis conducted on geographies consisting of 285,656,710 people shows a moderate positive correlation between the proportion of Yugoslavians and labor force participation rate among population between the ages 35 and 44 in the United States with a correlation coefficient (R) of 0.408 and weighted average of 84.9%. Similarly, the statistical analysis conducted on geographies consisting of 469,704,956 people shows a slight positive correlation between the proportion of Africans and labor force participation rate among population between the ages 35 and 44 in the United States with a correlation coefficient (R) of 0.098 and weighted average of 82.9%, a difference of 2.4%.
In Labor Force | Age 35-44 Correlation Summary
| Measurement | Yugoslavian | African |
| Minimum | 63.8% | 51.4% |
| Maximum | 100.0% | 100.0% |
| Range | 36.2% | 48.6% |
| Mean | 89.1% | 81.5% |
| Median | 87.9% | 82.1% |
| Interquartile 25% (IQ1) | 85.0% | 79.0% |
| Interquartile 75% (IQ3) | 97.4% | 85.1% |
| Interquartile Range (IQR) | 12.4% | 6.1% |
| Standard Deviation (Sample) | 8.3% | 10.0% |
| Standard Deviation (Population) | 8.2% | 9.9% |
Similar Demographics by In Labor Force | Age 35-44
Demographics Similar to Yugoslavians by In Labor Force | Age 35-44
In terms of in labor force | age 35-44, the demographic groups most similar to Yugoslavians are Greek (84.9%, a difference of 0.0%), Belgian (84.9%, a difference of 0.0%), Senegalese (84.9%, a difference of 0.010%), Immigrants from Peru (84.9%, a difference of 0.010%), and Immigrants from Middle Africa (84.9%, a difference of 0.010%).
| Demographics | Rating | Rank | In Labor Force | Age 35-44 |
| Immigrants | Eastern Europe | 98.3 /100 | #81 | Exceptional 84.9% |
| Immigrants | Sudan | 98.1 /100 | #82 | Exceptional 84.9% |
| Senegalese | 97.8 /100 | #83 | Exceptional 84.9% |
| Immigrants | Peru | 97.8 /100 | #84 | Exceptional 84.9% |
| Immigrants | Middle Africa | 97.8 /100 | #85 | Exceptional 84.9% |
| Greeks | 97.8 /100 | #86 | Exceptional 84.9% |
| Belgians | 97.7 /100 | #87 | Exceptional 84.9% |
| Yugoslavians | 97.7 /100 | #88 | Exceptional 84.9% |
| Immigrants | Pakistan | 97.5 /100 | #89 | Exceptional 84.9% |
| Immigrants | France | 97.4 /100 | #90 | Exceptional 84.9% |
| Immigrants | Europe | 97.2 /100 | #91 | Exceptional 84.9% |
| Ghanaians | 97.2 /100 | #92 | Exceptional 84.8% |
| Immigrants | Northern Africa | 97.1 /100 | #93 | Exceptional 84.8% |
| Mongolians | 96.8 /100 | #94 | Exceptional 84.8% |
| Immigrants | Kuwait | 96.7 /100 | #95 | Exceptional 84.8% |
Demographics Similar to Africans by In Labor Force | Age 35-44
In terms of in labor force | age 35-44, the demographic groups most similar to Africans are Chippewa (82.9%, a difference of 0.010%), Pennsylvania German (82.9%, a difference of 0.020%), Puget Sound Salish (82.9%, a difference of 0.030%), Immigrants from Belize (82.9%, a difference of 0.040%), and Fijian (82.9%, a difference of 0.050%).
| Demographics | Rating | Rank | In Labor Force | Age 35-44 |
| Immigrants | Guatemala | 0.0 /100 | #283 | Tragic 82.9% |
| Immigrants | Dominican Republic | 0.0 /100 | #284 | Tragic 82.9% |
| Fijians | 0.0 /100 | #285 | Tragic 82.9% |
| Immigrants | Bangladesh | 0.0 /100 | #286 | Tragic 82.9% |
| Immigrants | Belize | 0.0 /100 | #287 | Tragic 82.9% |
| Puget Sound Salish | 0.0 /100 | #288 | Tragic 82.9% |
| Chippewa | 0.0 /100 | #289 | Tragic 82.9% |
| Africans | 0.0 /100 | #290 | Tragic 82.9% |
| Pennsylvania Germans | 0.0 /100 | #291 | Tragic 82.9% |
| Immigrants | Latin America | 0.0 /100 | #292 | Tragic 82.8% |
| Spanish Americans | 0.0 /100 | #293 | Tragic 82.8% |
| Potawatomi | 0.0 /100 | #294 | Tragic 82.7% |
| Immigrants | Lebanon | 0.0 /100 | #295 | Tragic 82.7% |
| Mexican American Indians | 0.0 /100 | #296 | Tragic 82.6% |
| Hmong | 0.0 /100 | #297 | Tragic 82.6% |