Immigrants from Hungary vs Hungarian In Labor Force | Age 35-44
COMPARE
Immigrants from Hungary
Hungarian
In Labor Force | Age 35-44
In Labor Force | Age 35-44 Comparison
Immigrants from Hungary
Hungarians
84.4%
IN LABOR FORCE | AGE 35-44
59.4/ 100
METRIC RATING
162nd/ 347
METRIC RANK
84.2%
IN LABOR FORCE | AGE 35-44
26.8/ 100
METRIC RATING
193rd/ 347
METRIC RANK
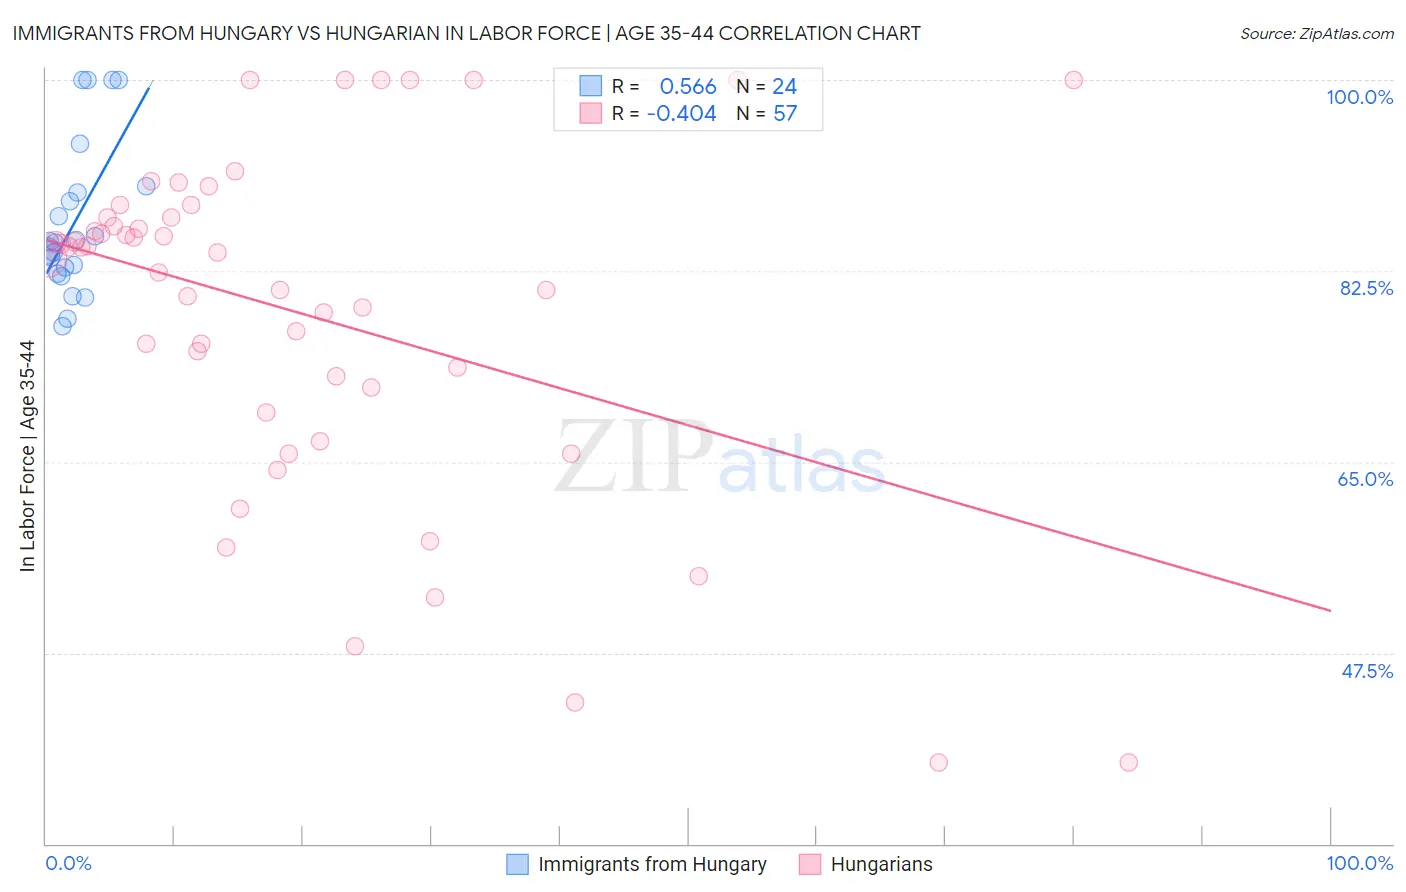
Immigrants from Hungary vs Hungarian In Labor Force | Age 35-44 Correlation Chart
The statistical analysis conducted on geographies consisting of 195,647,113 people shows a substantial positive correlation between the proportion of Immigrants from Hungary and labor force participation rate among population between the ages 35 and 44 in the United States with a correlation coefficient (R) of 0.566 and weighted average of 84.4%. Similarly, the statistical analysis conducted on geographies consisting of 485,922,886 people shows a moderate negative correlation between the proportion of Hungarians and labor force participation rate among population between the ages 35 and 44 in the United States with a correlation coefficient (R) of -0.404 and weighted average of 84.2%, a difference of 0.22%.
In Labor Force | Age 35-44 Correlation Summary
| Measurement | Immigrants from Hungary | Hungarian |
| Minimum | 77.5% | 37.5% |
| Maximum | 100.0% | 100.0% |
| Range | 22.5% | 62.5% |
| Mean | 87.1% | 78.6% |
| Median | 85.1% | 84.2% |
| Interquartile 25% (IQ1) | 82.5% | 70.7% |
| Interquartile 75% (IQ3) | 90.0% | 87.4% |
| Interquartile Range (IQR) | 7.5% | 16.7% |
| Standard Deviation (Sample) | 7.0% | 15.7% |
| Standard Deviation (Population) | 6.9% | 15.6% |
Similar Demographics by In Labor Force | Age 35-44
Demographics Similar to Immigrants from Hungary by In Labor Force | Age 35-44
In terms of in labor force | age 35-44, the demographic groups most similar to Immigrants from Hungary are Immigrants from Venezuela (84.4%, a difference of 0.0%), Aleut (84.4%, a difference of 0.0%), Nigerian (84.4%, a difference of 0.0%), Immigrants from Senegal (84.4%, a difference of 0.010%), and Immigrants from Kazakhstan (84.4%, a difference of 0.010%).
| Demographics | Rating | Rank | In Labor Force | Age 35-44 |
| Immigrants | Switzerland | 65.9 /100 | #155 | Good 84.5% |
| Immigrants | Israel | 64.3 /100 | #156 | Good 84.4% |
| Immigrants | Austria | 63.8 /100 | #157 | Good 84.4% |
| Jamaicans | 62.7 /100 | #158 | Good 84.4% |
| Immigrants | Senegal | 60.4 /100 | #159 | Good 84.4% |
| Immigrants | Kazakhstan | 60.4 /100 | #160 | Good 84.4% |
| Immigrants | Venezuela | 60.0 /100 | #161 | Good 84.4% |
| Immigrants | Hungary | 59.4 /100 | #162 | Average 84.4% |
| Aleuts | 59.1 /100 | #163 | Average 84.4% |
| Nigerians | 58.9 /100 | #164 | Average 84.4% |
| Venezuelans | 58.1 /100 | #165 | Average 84.4% |
| Alsatians | 55.2 /100 | #166 | Average 84.4% |
| Immigrants | Portugal | 55.2 /100 | #167 | Average 84.4% |
| Irish | 53.1 /100 | #168 | Average 84.4% |
| Immigrants | Afghanistan | 52.7 /100 | #169 | Average 84.4% |
Demographics Similar to Hungarians by In Labor Force | Age 35-44
In terms of in labor force | age 35-44, the demographic groups most similar to Hungarians are Immigrants from Philippines (84.2%, a difference of 0.010%), Immigrants from Vietnam (84.2%, a difference of 0.010%), Immigrants from Indonesia (84.2%, a difference of 0.010%), Immigrants from Caribbean (84.2%, a difference of 0.010%), and Immigrants from England (84.2%, a difference of 0.010%).
| Demographics | Rating | Rank | In Labor Force | Age 35-44 |
| Australians | 35.1 /100 | #186 | Fair 84.3% |
| Dutch | 34.8 /100 | #187 | Fair 84.3% |
| South Africans | 34.1 /100 | #188 | Fair 84.3% |
| Immigrants | Denmark | 33.7 /100 | #189 | Fair 84.3% |
| Portuguese | 31.9 /100 | #190 | Fair 84.3% |
| Immigrants | Philippines | 27.9 /100 | #191 | Fair 84.2% |
| Immigrants | Vietnam | 27.4 /100 | #192 | Fair 84.2% |
| Hungarians | 26.8 /100 | #193 | Fair 84.2% |
| Immigrants | Indonesia | 25.7 /100 | #194 | Fair 84.2% |
| Immigrants | Caribbean | 25.7 /100 | #195 | Fair 84.2% |
| Immigrants | England | 25.0 /100 | #196 | Fair 84.2% |
| Immigrants | Western Europe | 24.7 /100 | #197 | Fair 84.2% |
| Ecuadorians | 24.0 /100 | #198 | Fair 84.2% |
| Syrians | 23.2 /100 | #199 | Fair 84.2% |
| Moroccans | 23.2 /100 | #200 | Fair 84.2% |